Diversity is a real strength. By now it is common knowledge. I often see institutions openly encourage multinational environment and multidisciplinary professionals, with specific “on-the-job” training to tailor for own needs. No one knows a lot about a lot, so bringing different together enhance independent thinking and knowledge available to the organization. Clarity of communication then becomes even more important, and making sure your figures are quickly understandable goes a long way.
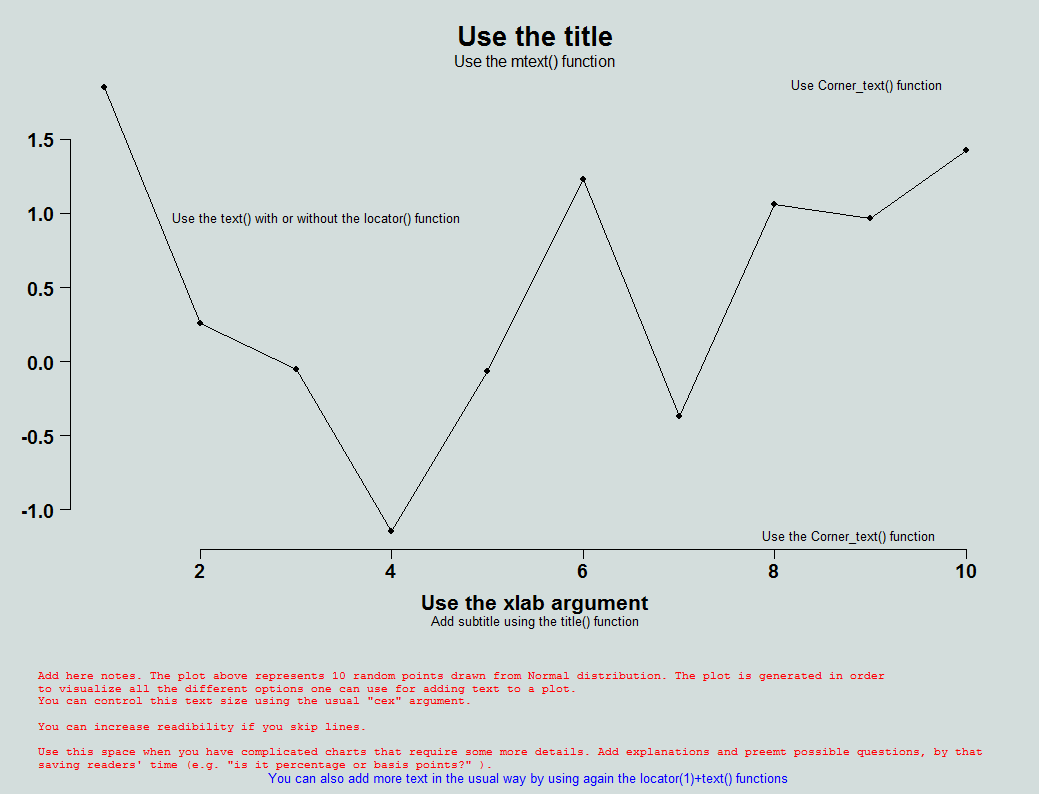
Same-field quickly understand what others from the same field are doing simply by reading few formulas or looking at few charts, but different-field needs longer to digest. One thing we can do is use available spaces to better explain what is it that we see in a chart, by that speeding communication and sharing. I have created a concise summary of all (most?) available options. The code and relevant functions below.
|
1 2 3 4 5 6 7 8 9 10 11 12 13 14 15 16 17 18 19 20 21 22 23 24 25 26 27 |
layout(matrix(c(1,1,2,2), 2, 2, byrow = T), heights = c(4,1)) plot(rnorm(10),ylab="", xlab="Use the xlab argument", main="Use the title", ty="o", pch=19) mtext("Use the mtext() function") temp <- locator(1) # On the chart, click where you would like the text to appear text(temp,"Use the text() with or without the locator() function") Corner_text <- function(text, location="topright"){ legend(location,legend=text, bty ="n", pch=NA) } Corner_text(text="Use Corner_text() function") Corner_text(text="Use the Corner_text() function",location= "bottomright") title(sub="Add subtitle using the title() function") library(gplots) # ?textplot #layout.show(2) # plot(rnorm(20),ylab="", xlab="Use the xlab argument", main="Use the title", ty="o", pch=19) temptext1 <- "Add here notes. The plot above represents 10 random points drawn from Normal distribution. The plot is generated in order to visualize all the different options one can use for adding text to a plot. You can control this text size using the usual \"cex\" argument. \nYou can increase readibility if you skip lines. \nUse this space when you have complicated charts that require some more details. Add explanations and preemt possible questions, by that saving readers' time (e.g. \"is it percentage or basis points?\" )." temptext2 <- "You can also add more text in the usual way by using again the locator(1)+text() functions" textplot(temptext1, valign="center", cex=0.8, halign= "left", mar=c(0,0,0,0), col=2) # mar=c(0,0,0,0) removes the margins temp <- locator(1) text(temp, temptext2,col=4) |


