In the previous post we reviewed a way to handle the problem of inference after model selection. I recently read another related paper which goes about this complicated issues from a different angle. The paper titled ‘A significance test for the lasso’ is a real step forward in this area. The authors develop the asymptotic distribution for the coefficients, accounting for the selection step. A description of the tough problem they successfully tackle can be found here.
The usual way to test if variable (say variable j) adds value to your regression is using the F-test. We once compute the regression excluding variable j, and once including variable j. Then we compare the sum of squared errors and we know what is the distribution of the statistic, it is F, or  , depends on your initial assumptions, so F-test or -test. These are by far the most common tests to check if a variable should or should not be included. Problem arises if you search for variable j beforehand.
If you chose variable j from a pool of possible variables to add, the statistic is no longer distributed as you think, not F and not . To continue with the usual significance testing using F-test for example after model selection is a blunt mistake. You think you will can have a 95% confidence level, but in fact it is much much lower. In the paper ‘A significance test for the lasso’ the authors show how to use the LASSO solution to construct a quantity (their equation (5)) which has a known asymptotic distribution. I replicate their simulation settings. We have 10 possible variables which non matters (in the simulation we know it, but in reality we do not). Meaning the process is actually:
![\[y_t &= \varepsilon_t.\]](https://eranraviv.com/wp-content/ql-cache/quicklatex.com-68a2dfcd6c405c9d58aa529d100e28ef_l3.svg "Rendered by QuickLaTeX.com")
We check which is best from the 10 available and test if it is significant. Have a look at the next figure which replicates their Figure (1) in the actual paper:
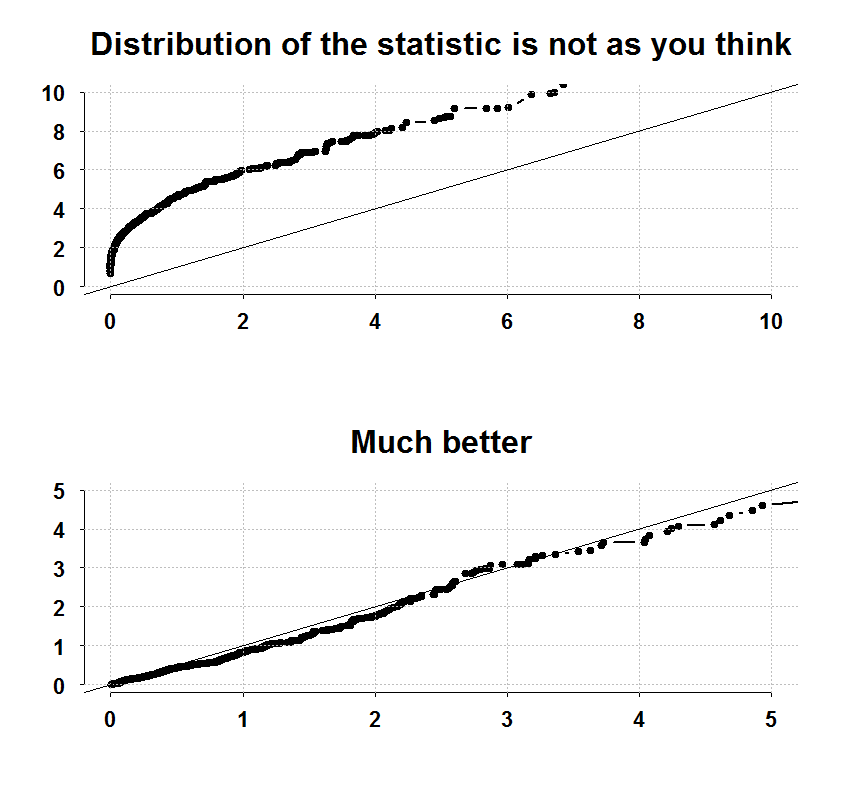
Upper panel shows a quantile-quantile plot of the statistic computed in the usual erroneous way. You can see it is not at all distributed the way it should be. The lower panel shows a quantile-quantile plot with the test statistic the authors develop. The statistic has an exponential distribution. Check the type one error rate:
|
1 2 3 4 5 6 7 8 |
# The actual type 1 error in the upper panel (should be 0.05) sum(maxstat>qf(0.05,1,(TT-2),lower.tail=F))/R 0.396 # The actual type 1 error in the lower panel (should be 0.05) sum(covstat>qexp(0.05,1,lower.tail=F))/R 0.066 |
The code to generate the figure is below. But lets have a look at an empirical example. Lets use the idea to check what is important for Industrial Production (U.S data). Consider the interest rate and the unemployment rate, their squares and their interaction. We can now test if anything is useful, accounting for the fact that we a-priori select the one that best fit the data.
Natural start is the usual linear regression:
|
1 2 3 4 5 6 7 8 9 10 11 12 13 14 15 16 17 18 19 20 21 22 23 24 25 26 27 28 29 30 31 32 33 34 35 36 |
dat = as.matrix(read.table(file = "https://dl.dropbox.com/u/9409065/UnemployementData.txt",header=T) ) IP <- diff(dat[,3]) UR <- diff(dat[,1]) SR <- diff(dat[,2]) TT <- NROW(IP) nam <- c('Const','Unemployment Rate','Short Rate', 'Interaction', 'Squared Unemployment Rate', 'Squared Short Rate') X <- cbind(rep(1,TT),UR,SR, UR*SR, UR^2, SR^2) colnames(X) <- nam cor(X) y <- IP simple_regression <- lm(IP~0+X) summary(simple_regression) Call: lm(formula = IP ~ 0 + X) Residuals: Min 1Q Median 3Q Max -3.957 -0.200 0.012 0.230 1.663 Coefficients: Estimate Std. Error t value Pr(>|t|) XConst 0.1502 0.0193 7.78 3.1e-14 *** XUnemployment Rate -0.9028 0.0988 -9.14 < 2e-16 *** XShort Rate 0.1039 0.0446 2.33 0.020 * XInteraction -0.0265 0.1857 -0.14 0.887 XSquared Unemployment Rate -0.7906 0.2972 -2.66 0.008 ** XSquared Short Rate -0.0140 0.0217 -0.64 0.521 --- Signif. codes: 0 ‘***’ 0.001 ‘**’ 0.01 ‘*’ 0.05 ‘.’ 0.1 ‘ ’ 1 Residual standard error: 0.419 on 621 degrees of freedom Multiple R-squared: 0.244, Adjusted R-squared: 0.237 F-statistic: 33.5 on 6 and 621 DF, p-value: <2e-16 |
Looks good, but is it really the case that we need all those asterisks?
Enter covariance test. This is the test they develop in the paper. What makes it a valid test is that they derive the asymptotic distribution (don’t ask me how) which turns out to be exponential.
|
1 2 3 4 5 6 |
library(covTest) X <- X[,-1] # remove the intercept, lars function standardize the X a <- lars(X,y,ty="lasso") plot(a) |
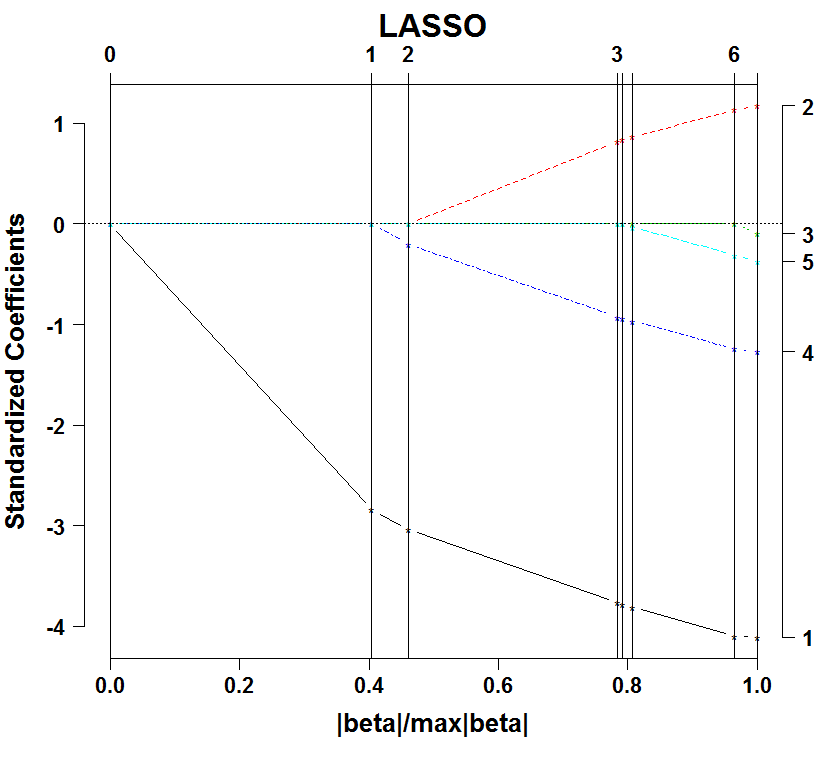
The plot shows the ordering in which the variables enter. Unemployment rate is first (variable 1), following by its squared (variable 4), followed by the interest rate (variable 2), etc. By the way, this sequence is given the fancy name ‘regularization path’.
Now what we do is to test whether the next entry is significant, given the variables already existing in the regression, and also accounting for the greedy selection step:
|
1 2 3 4 5 6 7 8 9 10 |
covTest(a,X,y, sigma.est = summary(simple_regression)$sig) $results Predictor_Number Drop_in_covariance P-value 1 77.8605 0.0000 4 1.5259 0.2174 2 5.3634 0.0047 3 0.0056 0.9944 5 0.0347 0.9659 |
The first one is important, but the square is not. However, if they are both already in, the interest rate is important, the rest is not. From this, depends on how parsimonious you want to be, you can use variable 1, or the first 3 (but not only 1 and 2). The authors write about this somewhat confusing non-transitive relation:
‘For a general X, however, a given predictor variable may enter the active set more than once along the lasso path, since it may leave the active set at some point. In this case we treat each entry as a separate problem. Therefore, our test is specific to a step in the path, and not to a predictor variable at large.’
So, those p.values should not be taken jointly but as an individual conditional tests. A warm recommendation to read that paper. A link to a working version of the paper is given below. It was eventually published in ‘The Annals of Statistics’.
Code for replicating the figure:
|
1 2 3 4 5 6 7 8 9 10 11 12 13 14 15 16 17 18 19 20 21 22 23 24 25 26 27 28 29 30 31 32 33 34 35 |
library(Eplot) ; library(covTest) TT <- 100 ; p=10 ; R <- 500 stat <- pv <- matrix(nrow = p,ncol=R) maxstat <- correct_pv <- f <- covstat <- fstat <- NULL for (j in 1:R){ y <- rnorm(TT) y <- scale(y,scale=F) X <- matrix(nrow = TT, ncol = p) X <- apply(X,2,rnorm) X <- apply(X,2,scale,scale=F) a <- lars(X,y,ty="lasso") lambda <- a$lambda[2]-1/10^8 # one is the first variable to enter and we allow more distance, # up until but not included, the second variable to enter yhat = predict(a, X, s = lambda, type = "fit", mode = "lam")$fit lmfull <- lm(y~0+X) for (i in 1:p){ lm1 <- lm(y~0+X[,i]) f[i] <- summary(lm1)$f[1] } maxstat[j] <- max(f) # the usual F statistic for the best predictor covstat[j] <- my_cov_test(fit0 =rep(0,TT), fit1 = yhat, Sig_square=sum(lmfull$res^2)/(TT-p)) correct_pv[j] <- covTest(a,X,y,sigma=sqrt(sum(lmfull$res^2)/(TT-p)))$result[1,3] # the real p.value } fstat <- rf(R,1,TT-2) expstat <- rexp(R) plott(sort(maxstat),sort(fstat),return.to.default=F, ylim=c(0,10),xlim=c(0,10),main="Distribution of the statistic is not as you think") abline(0, 1) plott(sort(covstat),sort(expstat),return.to.default=F,ylim=c(0,5),xlim=c(0,5), main="Much better") abline(0, 1) |
The paper:
A significance test for the lasso
————-
Related book:


