This post concerns a paper I came across checking the nominations for best paper published in International Journal of Forecasting (IJF) for 2012-2013. The paper bears the annoyingly irresistible title: “The illusion of predictability: How regression statistics mislead experts”, and was written by Soyer Emre and Robin Hogarth (henceforth S&H). The paper resonates another paper published in “Psychological review” (1973), by Daniel Kahneman and Amos Tversky: “On the psychology of prediction”. Despite the fact that S&H do not cite the 1973 paper, I find it highly related.
From the “On the psychology of prediction”:
“Evidently, people respond differently when given no specific evidence and when given worthless evidence (my addition: or unreliable). When no specific evidence is given, the prior probabilities are properly utilized; when worthless specific evidence is given, prior probabilities are ignored.” Prior probabilities, or what they call base-rate, are what we have in our head without any additional information. For example we know the split between male and female in the population is roughly 50/50, so a priori we assume 50% chance that an individual is male. Now if we are told “the individual is a poker player”, we may adjust our decision accordingly. What is interesting is that as humans, we don’t care if the fact: “the individual is a poker player”, originates from a reliable or unreliable source. If the fact originates from perfectly reliable source, we may now legitimately assign 90% chance that the individual is male, but if the fact originates from a source that is completely unreliable, research shows that we overweight the information given, put differently, we don’t appropriately discount the fact that the source is unreliable.
I was lucky enough to sit in a Daniel kahneman’s lecture right after he got his Nobel-prize (which would be shared by Amos Tversky, should have he been alive). He there described an experiment whereby people used the result of a casino-like roulette to guide them in their reply to some question regarding the number of African nations in the UN, doing so knowingly. This is an example of what is now known as the “anchoring bias” in the literature, though I personally think it is much wider bias than anchoring. When we don’t know, we just use what we have, even if it is rubbish, even if we know it is rubbish.
The new paper of S&H specifically discusses regression and regression output. Their neat results show that people, actually researchers who should be even more equipped, find it hard to digest unreliable source, in this case a noisy regression, when presented in this pretty much everyday table:
| Dependent variable: | |
| y | |
| Constant | 4.650 (3.250) |
| x | 0.919*** (0.056) |
| Observations | 1,000 |
| Adjusted R2 | 0.209 |
| Note: | *p<0.1; **p<0.05; ***p<0.01 |
The R^2 says something about the noise in the model, 0.2 means substantial noise. This information is clouded by the (admittedly impressive) triple asterisk next to the slope coefficient. Although the model is very noisy, the fact that the slope parameter is significant affects also what we think about the model accuracy. Given the table, and the (admittedly impressive) triple asterisk we fail to discount the fact that the regression is noisy. S&H write: “The results suggest that it is the uncertainty concerning the estimated coefficients that is seen to be important, not the magnitude of the SER (standard error regression). In the jargon of popular econometrics texts, whereas respondents were sensitive to one of the two sources of prediction error, namely the sampling error, they ignored the error term of the regression equation. The apparent invisibility of the random component in the presentation lures respondents into disregarding the error term, and into confusing an outcome with its estimated expected value.” Simply put, not enough attention is given to model’s reliability in forecasting.
Wait wait, it gets interesting. Situation is improved if we aid the respondents, complementing the standard table with a visual support like so:
| Dependent variable: | |
| y | |
| Constant | 4.650 (3.250) |
| x | 0.919*** (0.056) |
| Observations | 1,000 |
| Adjusted R2 | 0.209 |
| Note: | *p<0.1; **p<0.05; ***p<0.01 |
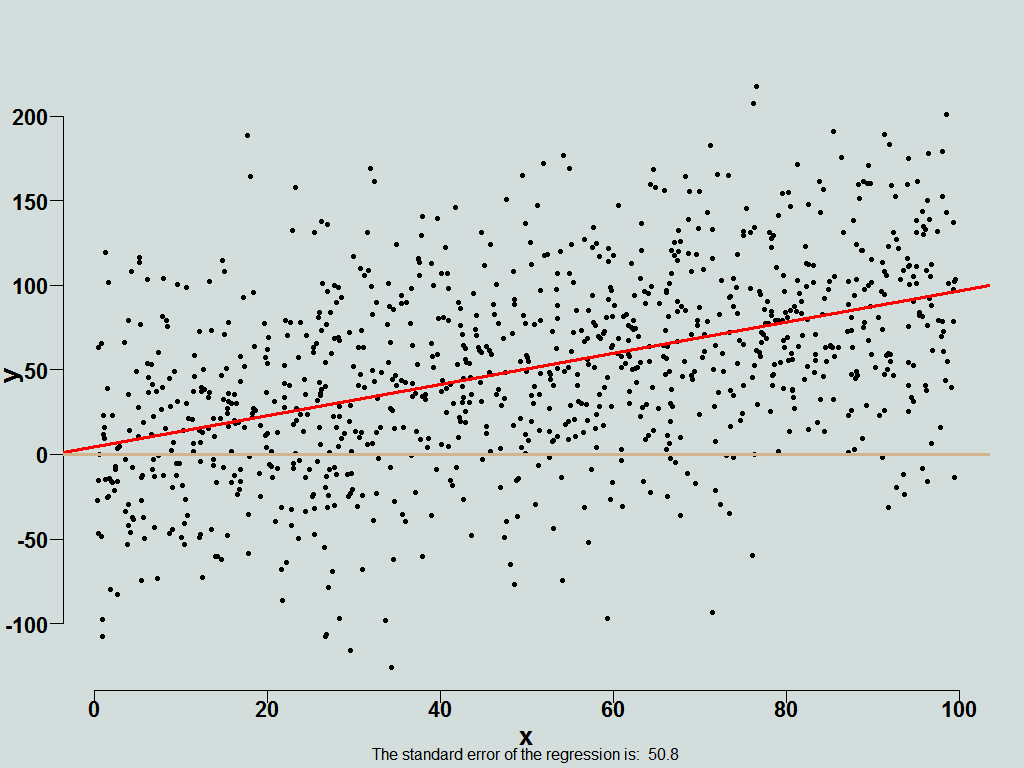
Now, hold on to your chair. Fantastically, it turns out that most accurate replies from respondents occurs if you remove the table altogether, and only show them this:
So, once you remove the information they cling to , the (admittedly impressive) triple asterisk, they now reply accurately. Neat indeed.
What is the price for this increased accuracy you might ask, as we know, no such animal as something for nothing. The answer is comfort, we give up our comfort. Respondents, after giving the most accurate replies, additionally complain that information given to them is insufficient, ha.
When you present, rather than providing details that are interesting, provide details that are relevant. Don’t be shy and omit distractions. We can’t blame anyone reaching for ‘terra firma’ when faced with uncertainty (did you see those triple asterisk??), best we remove those boguses whenever we can even if by doing so, we remove some sense of comfort along with it. Once more we see that less is more.
Unfortunately IJF did not make the paper freely available, but here is a presentation which provides more details, and there is also a working-paper version online.


Here is an example of the questions being asked:
1. What would be the minimum value of X that an individual would need to make sure that s/he obtains a positive outcome (Y > 0) with 95% probability?
I think the conclusions being drawn are far too broad. Unless you recently took a high level statistics course it is basically a trick question. 99% of math graduates would not be able to calculate the correct answer without a reference.
Hi Ryan,
My opinion is that this question and alike can quite easily be raised by a manager (say X is marketing budget and Y is some threshold number of conversions for example). In that sense I don’t see any trick here.
I think we agree the figure assists a correct reply.
Perhaps the word “experts” in the title of the paper is exaggerated, but recall those are scholars who are being asked.
The three asterisks only tell you that the coefficient has 99%+ probability of being different from zero. The confidence interval of the coefficient is probably very large.