One way to help us decide is to estimate a regime switching model for the VIX, see if the volatility crossed over to the bear regime.
Someone already wrote a great code for that in the open source R language, saved us some work. We estimate the threshold parameter once using long period and once using the most recent year:
|
1 2 3 4 5 6 7 8 9 10 11 12 13 14 15 16 17 18 19 20 21 22 |
library(quantmod) sym = c('^VIX') l=length(sym) end<- format(Sys.Date(),"%Y-%m-%d") start<-format(as.Date("2007-01-01"),"%Y-%m-%d") dat0 = (getSymbols(sym[1], src="yahoo", from=start, to=end, auto.assign = F)) time <- index(dat0) vix <- as.numeric(dat0[,4]+dat0[,1]+dat0[,2]+dat0[,3])/4 TT = NROW(vix) # Estimate once from 2007 sample, and once using the most recent year k=TT Tar0 <- setar(tail(vix,k), m=2, d=1,thDelay=1) th.all <- summary(Tar0)$thCoef k=250 Tar0 <- setar(tail(vix,k), m=2, d=1,thDelay=1) th.recent <- summary(Tar0)$thCoef plot(vix~time,main="VIX",xlab="",ylab="",ty="l") abline(h=th.all,col=3,lwd=4) abline(h=th.recent,col=2,lwd=4) legend('topright',c('Recent 250 days','From 2007'),col=c(2,3),lwd=3,bty="n") |
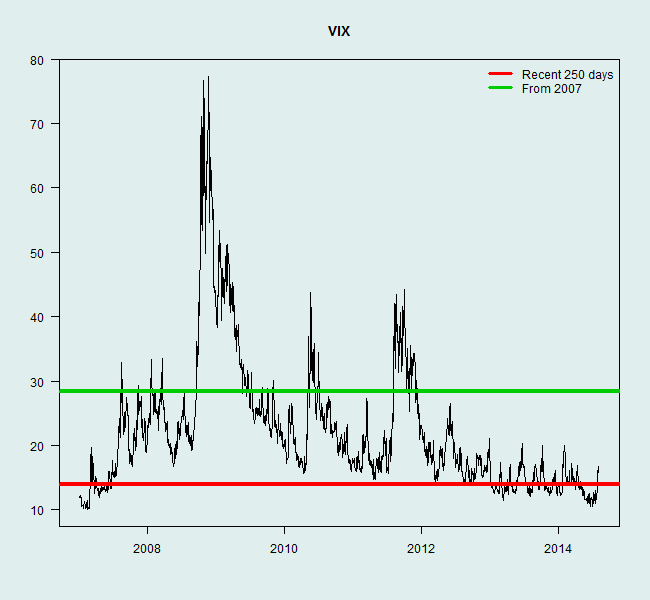
The green line is a threshold parameter estimated from the model based on a relatively long period, it classify the regimes; high and low. The red line is another estimate based on the most recent year.
VIX spiked last week. Eyeballing the chart we see it is nothing abnormal. However, the estimate suggests crossing into the bear regime – caution on the long side, I believe it. More on the underlying model can be found here.
Also related:
[asa onelinertpl]0198523009[/asa]
[asa onelinertpl]0521779650[/asa]
Disclaimer:
None of the information presented here or anywhere on the site is to be used as investment advice. Actions taken based on information presented on the site are most likely to bring monetary loss. The author is not responsible.


