The total nonfarm payroll accounts for approximately 80% of the workers who produce the GDP of the United States. Despite the widely acknowledged fact that the Nonfarm payroll is highly volatile and is heavily revised, it is still driving both bonds and equity market moves before- and after it is published. The recent number came at a weak 142K compared with around 200K average over the past 12M. What we wish we would know now, but will only know later, is whether this number is a start of a weaker expansion in the workforce, or not.
Despite the fact that it is definitely on the weak side (as you can see in the top panel of the figure), it is nothing unusual (as you can see in the bottom panel of the figure).
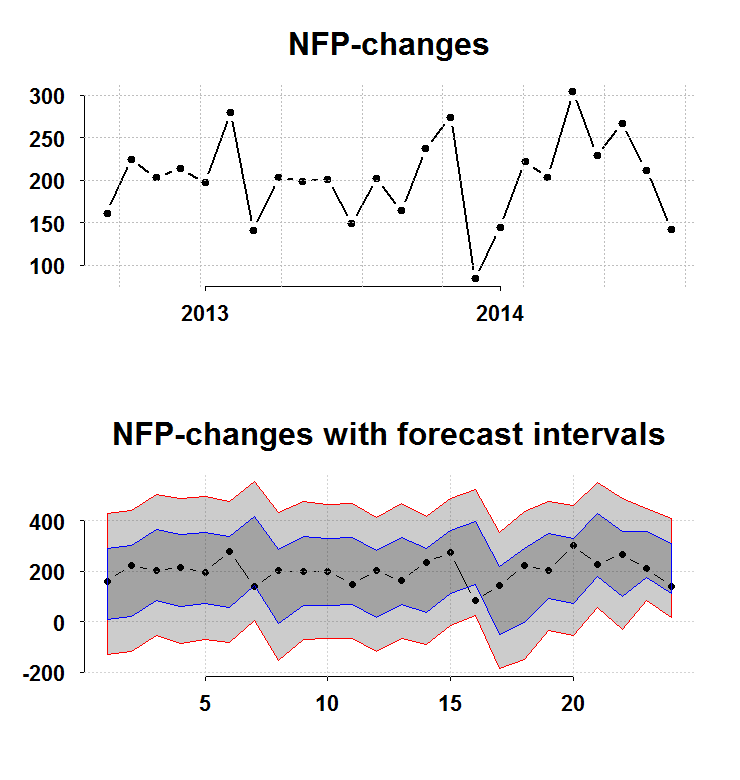
The bottom panel charts the interval you have before the number is publish (forecast intervals) from a simple AR(1) model without imposing normality. The blue and the red lines are 1 and 2 standard deviations respectively. The recent number barely scratches the bottom blue, so nothing to suggest a significant shift from a healthy 200K. On the other hand, there is some persistence:
|
1 2 3 4 5 6 7 8 9 10 11 12 13 14 |
ar.ols(na.omit(nfp)) Call: ar.ols(x = na.omit(nfp)) Coefficients: 1 2 3 4 5 6 0.2633 0.2672 0.1402 0.0841 0.1015 -0.0853 Intercept: 0.318 (5.906) Order selected 6 sigma^2 estimated as 31430 |
So, on average we can expect to trend lower.
Code for figure:
|
1 2 3 4 5 6 7 8 9 10 11 12 13 14 15 16 17 |
library(quantmod) library(Eplot) tempenv <- new.env() getSymbols("PAYEMS",src="FRED",env=tempenv) # Bring it to global env head(tempenv$PAYEMS) time <- index(tempenv$PAYEMS) nfp <- as.numeric(diff(tempenv$PAYEMS)) par(mfrow = c(2,1)) k = 24 args(plott) plott(tail(nfp,k),tail(time,k),return.to.default = F,main="NFP-changes") args(FCIplot) nfpsd <- FCIplot(nfp,k=k,rrr1="Rol",rrr2="Rol",main="NFP-changes; forecast intervals superimposed") |


Hi Eran,
Been following your blog for years, and this one happens to be my favourite as I’m very interested in learning about time-series forecasting.
What would you say are your top three books/ resources for learning about novel time series forecasting methods such as the one above? (preferably ones that don’t assume a highly technical background and provide some R code)
I’ve read/ skimmed through the commonly cited ones – Ruey Tsay, Rob Shumway, Jonathan Cryer etc – but I’m keenly interested in hearing your suggestions.
You have: and the free soft copy.
– R for Time Series free resource.
– Forecasting: principles and practice
– New Introduction to Multiple Time Series Analysis