When I was searching for data about U.S prison population, for another post, I ran across eurostat, a nice source for data to play around with. I pooled some numbers, specifically homicides recorded by the police. A panel data for 36 cities over time, from 2000 to 2009. Lets see which are the cities that have problems in this area.
The first few lines look like:
|
1 2 3 4 5 6 7 |
CITIES.TIME 2000 2001 2002 2003 2004 2005 2006 2007 2008 2009 1 Amsterdam 44 33 24 39 27 32 17 32 17 33 2 Athina 52 47 46 47 41 49 43 68 69 70 3 Belfast 21 15 16 4 8 15 9 6 2 6 4 Beograd 93 70 42 40 42 49 52 51 38 27 |
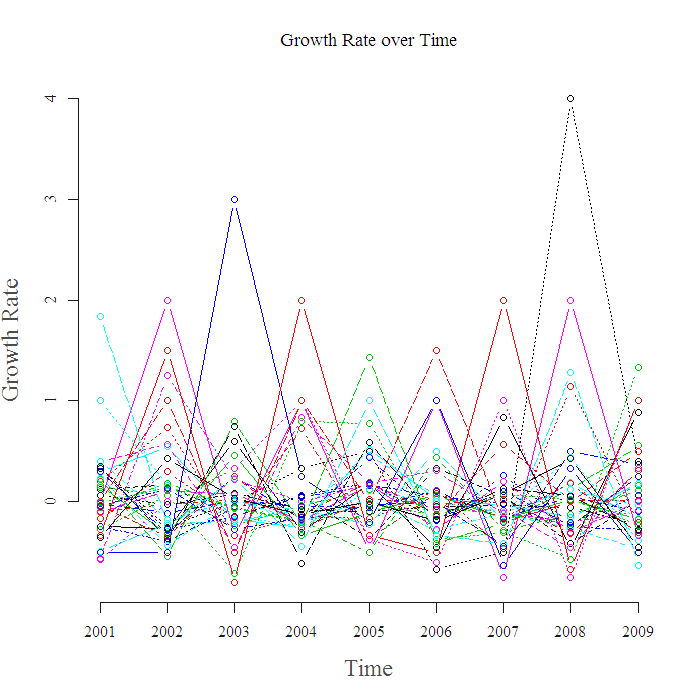
The graph for the growth rate looks like this:
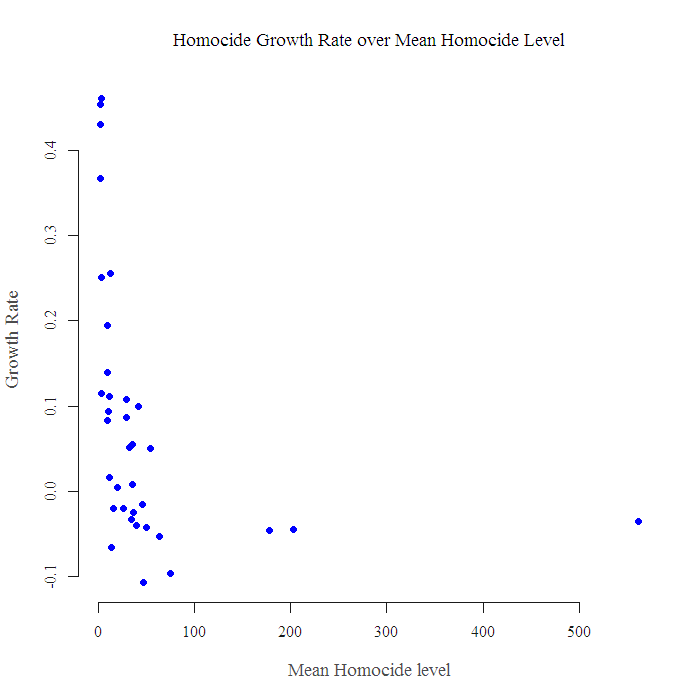
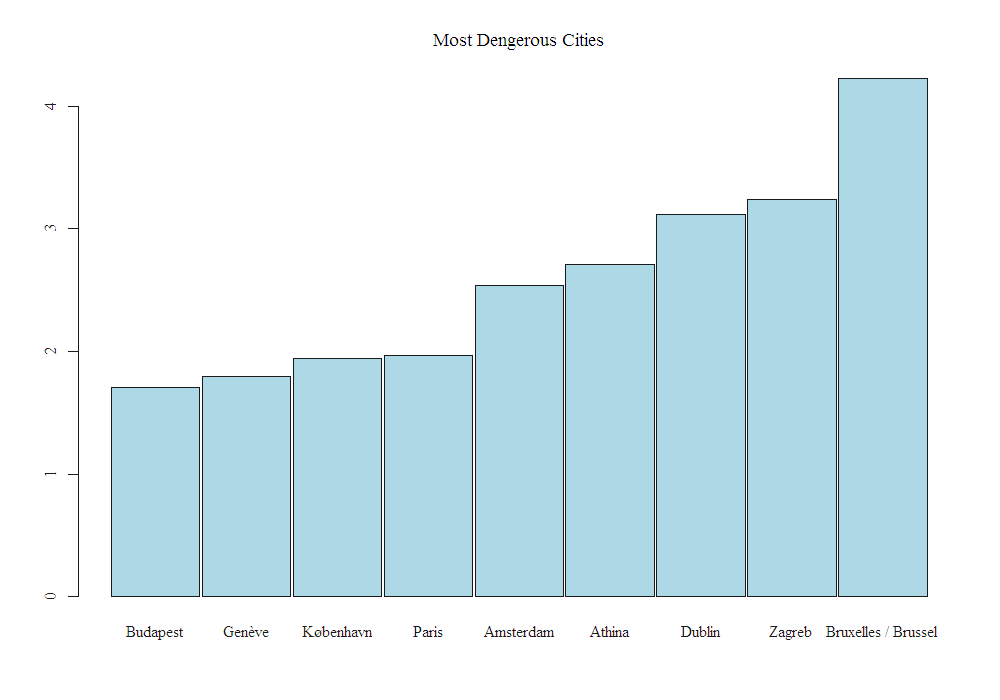
Despite it being very colorful, its not really useful. We can see many spikes meaning an increase of 300%, which of course derived from a city with a jump in homicide from one to three cases that year. Hadley Wickham gave a nice NBA example, where you better not pick the player with best percent accuracy, you will just end up with 5 people that shoot 100% which is based on one attempt at the hoop. Now what? We can use the level of homicide as a measure for the size of the city, so we get the following figure: Now we look for points (cities) that sit in the upper right quadrant. Which will mean, high growth rate coupled with high level of homicide. A way to do that is to order the observation according to the strange expression: $$\frac{Homicide Rate}{\frac{1}{average level} }$$
When Average level is low, the expression is low, and the reverse. the nominator is clear I hope. Now we order them and bar-plot the most problematic cities:
That is it. Thanks for reading. Code and references are below.
Comments:
1. Of course, I could have gotten some data on the actual population in these cities, but where is the fun in that?
2. Some of the most dangerous cities are not in, e.g. Marseilles-France or Sofia-Bulgaria, they are just not in the dataset.
Code:
|
1 2 3 4 5 6 7 8 9 10 11 12 13 14 15 16 17 18 19 20 |
t2 = read.table("/homocide1.txt", sep = "\t", header = T) head(t2, 4) ; dim(t2) ; names(t2) names(t2)[2:11] = seq(2000,2009,1) # drop the time index matplot(t(t2[,2:NCOL(t2)]), ty = "b", pch = 1) t22 = t2[,2:11]+1 # Avoid inf in the rate of change rt2 = t22[,2:NCOL(t22)]/t22[,1:(NCOL(t22)-1)] - 1 matplot(t(rt2), ty = "b", pch = 1, xaxt = "n", xlab = "Time", ylab = "Growth Rate", cex.lab = 1.5, main = "Growth Rate over Time") axis(side = 1, at = c(1:9), labels = seq(2001,2009,1)) plot(apply(rt2,1,mean)~apply(t22[,2:10],1,mean), pch = 19, xlab = "Mean Homocide level", cex.lab = 1.2, ylab = "Growth Rate", col = "blue", main = "Homocide Growth Rate over Mean Homocide Level") a1 = apply(rt2,1,mean)/(1/apply(t22[,2:10],1,mean)) # the funny expression x11() d = 1.5 # just few largest a2 = sort(a1[a1>d]) barplot(a2, names.arg = t2[c(as.numeric(names(a2))),1], horiz = F, cex.names = 1, space = 0.03, angle = 45, density=NULL, col = "lightblue",width = .2, main ="Most Dengerous Cities" ) |
Related:
[asa onelinertpl]1243449268[/asa]
[asa onelinertpl]1439810184[/asa]


Hi Eran. You have a really nice blog.
It’s really surprising to see how close Amsterdam and Athens are! Having lived in both cities, I would never expect that. And Brussels more dangerous than Athens? Wow.
Hi Bruna,
Thanks for the comment.
Indeed, but bear in mind I am just looking at homicides, not just that but growth rate of homicides, so dangerous in that sense. Apart from that the post is also about the analytical exercise which is simple and fast.
Hey, just to mention something – the Irish (and thus Dublin too) homicide statistics published by the Central Statistics Office in Ireland and then sourced by all the third party stat companies includes dangerous driving leading to death in its homicide figures. For example, in 2011 there were 63 homicides in the whole country, 21 of these were dangerous driving leading to death. That leaves 42 actual homicides (3 of which were manslaughter offences). I don’t know about ALL the other countries but I know that, for example, the UK certainly doesn’t list motor deaths with homicides.
Hi Chris,
Thanks for the comment.
Eran