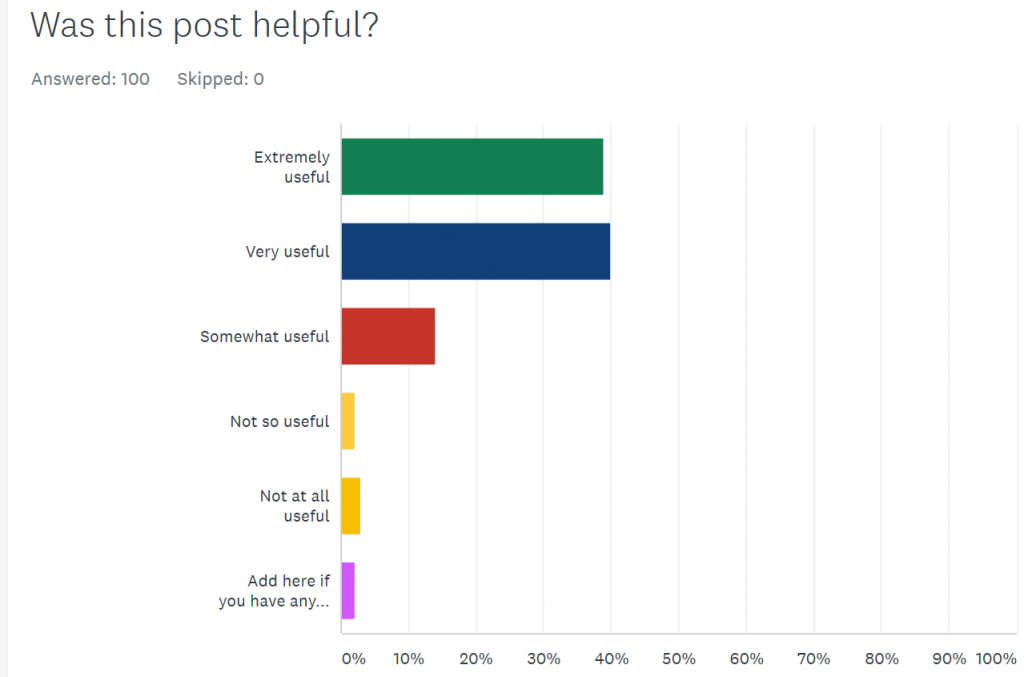
As every year, I checked my analytics so that I can let you know what was popular. This year I have also experimented with a survey where I asked one question at the end of each relevant post. About 120 replies recieved, but the free Survey Monkey account (the survey provider I went with) only lets out the first 100 replies, and no exports*. Here are the results:
Partial survey results

Looks nice, but probably highly biased. The survey appears at the end of the html page, so only readers who were done reading, actually reach the survey- so if they are reading all the way through they are probably very interested, while if they leave halfway through they don’t fill in their replies. Still it looks like many readers are happy with at least some content, which is nice to see. Now for the most popular posts for 2019.
By far the clear winner is Understanding Variance Explained in PCA (5:54 minutes average time on page). Followed by Adaptive Huber Regression (4:22 minutes average time on page). Followed by Portfolio Construction Tilting towards Higher Moments (5:43 minutes average time on page)
Own personal favorites:
Day of the week and the cross-section of returns (3:29 minutes average time on page)
The lowest readers/effort ratio was the post CUR matrix decomposition for improved data analysis. However, the lowest ratio this year was not as low as in previous years.
Thank you for reading, for sharing, for your emails, and for your corrections and comments.
Happy and productive 2020!

pic credit: Morvanic Lee
* I would like of course to dive into the individual post level. You can try polleverywhere for what looks like a decent alternative.


One comment on “Most popular posts – 2019”