When we speak about volatility we generally refer to the relative movement of an instrument, say stock, from its center, say average. So high volatility instrument means high swings in its price process. In recent years, with the increase in “fire power”, both in computing and information flow, there has been a spike in analysis of intra-day data. Data that describes the price within the day, as oppose to the more conventional, “open” (open price of the stock for the day) and “close” quotes.
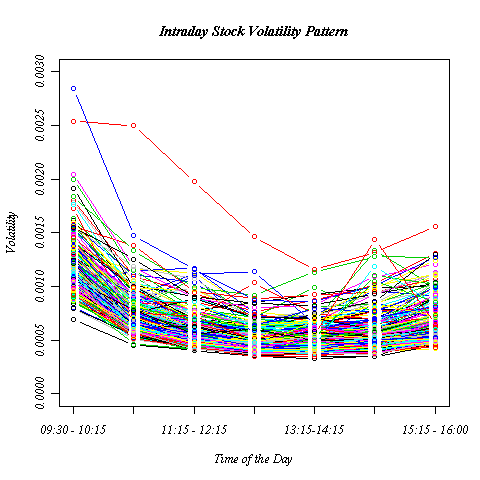
We take a look at the pattern of “swings” from stock prices within the day.
Off the top of my head, one implication I can think of is, e.g. limit price order might have a better chance of execution at the beginning of the day when the volatility is higher. The “swings” have a better chance to catch the limit, than in the midst of the trading day. Hence you can get better execution price (on average) during more volatile hours.
I use intra-day data, snap shot of every minute of every day for every stock in the S&P 100 throughout 2010, an overall 240 trading days.
I calculate the returns. I estimate the volatility for every hour using 3 different estimators, and average them to get quite accurate estimate. (exact details in the appendix).


nice
thanks