Very.
If you have 10 possible independent regressors, and none of which matter, you have a good chance to find at least one is important.
A good chance being 40%: prob(one or more looks important) = 1 – prob(non looks important) =
(1)
So, on average, you have around 60% chance to get the correct conclusion. Note that more data does nothing to solve this. Imagine 10 independent trading strategies backtested. Imagine 100. Related post is do-they-really-know-what-they-are-doing where I made the point not to get so excited by a money manager with a very high sharp (or information) ratio.
It is also the reason for my principle point in the R talk I gave in AmsteRdam, know where the profits (losses) stem from, what is the story behind what the speculator does.
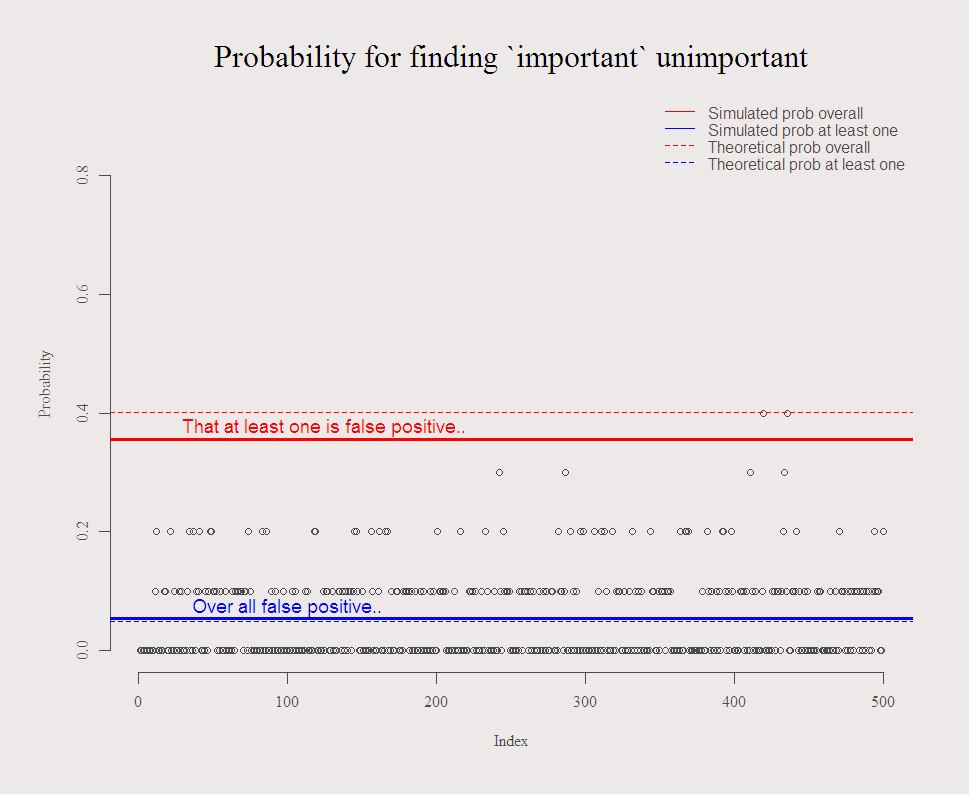
The following code illustrates the problem, the chance of finding “important” unimportant variables. You can play around with the parameters and double check that increased N does nothing to mitigate the problem.
|
1 2 3 4 5 6 7 8 9 10 11 12 13 14 15 16 17 18 19 20 21 22 23 24 25 26 27 28 29 30 31 32 33 34 35 36 37 |
options(digits = 3) c0 <- function(TT=100,k = 10, distrib = rnorm){ k <<- k # Write it upwards - we use it later.. y <- distrib(TT) x <- matrix(nrow = TT, ncol = k) for (i in 1:k){ x[,i] = distrib(TT) } lm0 <- list() pv <- NULL signif1 <- NULL for (i in 1:k){ lm0 <- lm(y~x[,i]) pv[i] <- summary(lm0)$coefficients[2,4] # Extract the P.values } return( list(p = sum(pv<.05)/k , signif1 = any(pv<.05) )) } c1 <- c2 <- NULL M <- 500 # Repeat this exercise M times for (i in 1:M){ c1[i] <- c0(TT = 100,k = 10)$p c2[i] <- c0(TT = 100,k = 10)$signif1 } par(mfrow = c(1,1)) plot(c1, ylim = c(0,.9), main = "Probability for finding `important` unimportant", cex.main = 2, ylab = "Probability") abline(a = mean(c1), b = 0, lwd = 3, col = 4) abline(a = sum(c2)/M, b = 0, lwd = 3, col = 2) abline(a = 0.05, b = 0, lwd = 1, col = 4, lty = 2) abline(a = 1-.95^k, b = 0, lwd = 1, col = 2, lty = 2) # here we need k text(x = M/5, y = mean(c1) + 0.02, "Over all false positive..", col = 4, cex = 1.2) text(x = M/4, y = sum(c2)/M + 0.02, "That at least one is false positive..", col = 2, cex = 1.2) legend("topright", c("Simulated prob overall","Simulated prob at least one", "Theoretical prob overall","Theoretical prob at least one"), bty = "n", col = c(2,4,2,4),lty=c(1,1,2,2) ) |
Run the code to get the typical figure:

You might also like:


Thanks for the post. Very informative.
There is a good discussion of this issue in Maindonald and Braun Section 6.5. John Maindonald developed the function bestsetNoise() (DAAG package) that can be used to make a similar point.
Tony