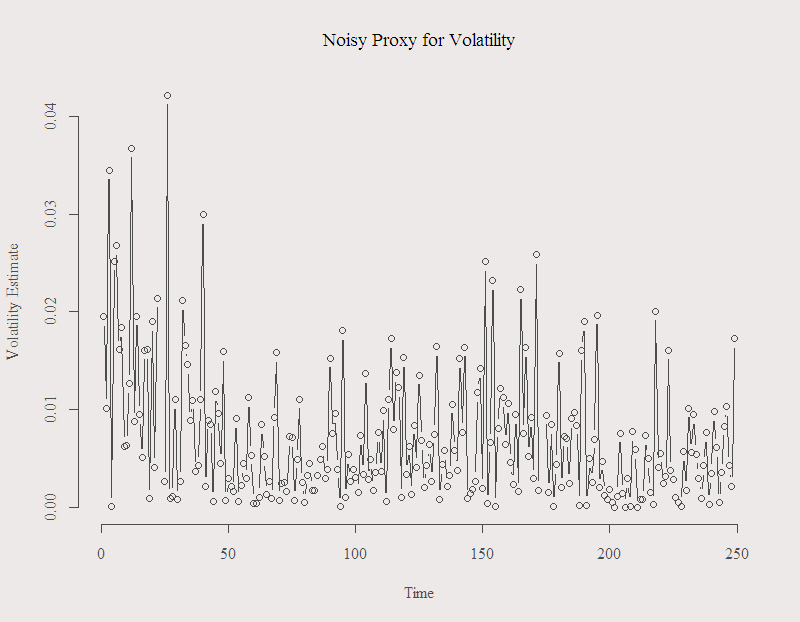
Volatility is unobserved. Hence we need to use observed quantity as a proxy. Every once in a while I still see people using squared daily return as a proxy. However, there is ample evidence that it is a bad one. Bad in a sense that it is noisy, which means that although on average it is a good estimate, on any individual day the estimate can be very far from the actual unobserved volatility. Here is a figure of the alleged standard deviation in the form of (square root of the) squared daily return for the recent year:
 You can see that in many days, this noisy estimate suggests that the volatility was around 2% and more. To me, it does not make too much sense. The series is the S&P 500, so a move of 3% is a BIG one. You can also see how “jumpy” the series is. The figure illustrates why we should avoid using this estimate.
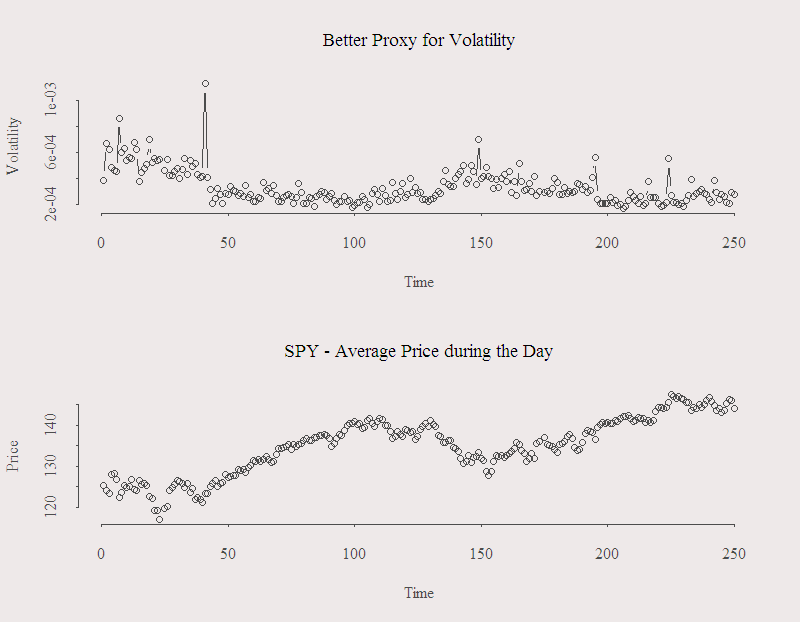
Here are three other estimators. The estimators are based on the full path of the price during the day which makes them empirically and theoretically more reliable. The resulting figure:
 The figure is based on Intra-day measures of volatility, code here.
Two important differences. First, the estimate that was before too high, is now too low. This has to do with the frequency in which we sample the price path during the day. I used one minute which is not high enough frequency, for a more accurate estimate we need a 15 seconds interval for example. Second, the estimate are more stable and are not as “jumpy” as before. I have made the data for this post public. It can be found here. It is an R object, an array under the name prlev, (Price in levels). It contains data (high, low, open, close, volume, etc.) on the SPY ticker, frequency in minutes.


