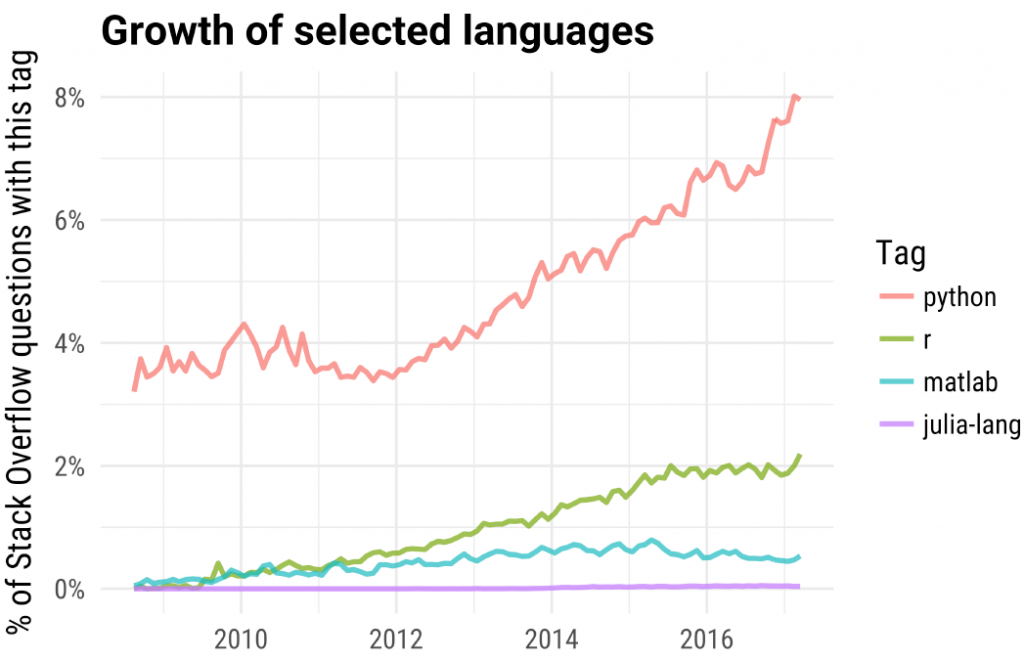
In this post about the most popular machine learning R packages I showed the incredible- exponential growth displayed by R software, measured by the number of package downloads. Here is another graph which shows a more linear growth in R (and an impressive growth in python) as measured by % of question posted in stack overflow
(taken from a talk given by David Robinson).

Dr. Uwe Ligges, one of the champions in the R core tranches presented a similar picture in his recent keynote talk during the 2017 useR! conference. Dr. Ligges is not the most colorful guy you encountered, but I thoroughly enjoyed his talk (20 years of CRAN I think it was called- post a link in the comments if you find the slides or youtube). His talk got me thinking about package dependencies and how fragile your code can get.
Those packages (think code snippets), contributed by the finest minds no doubt (tapping on my own shoulder as well here) are one of the definite strengths of the R software. For almost whichever statistical method you can think of, you have a package for it. Many packages now don’t start from scratch, but from other packages. This is to say, they depend on someone else’s code. This should not intimidate you, yet. Now, as a result of this exponential growth, someone else’s code depends on someone else’s code. Look closely and you may quickly find out that someone else’s code also depends on .. you guessed it, someone else’s code.
This may or may not make you feel uncomfortable, but code that depends on very many packages can be fragile in the sense that some functions can break down when one of those someones makes a substantial change in a code your functions rely on.
There are couple of ways to figure out how many packages a package rely on. The first is using the tools package:
|
1 2 3 4 5 6 7 |
library(tools) pack_dep <- package_dependencies(packages= "glmnet", which = c("Depends", "Imports"), recursive = T) length(unlist(pack_dep)) # number of packages pack_dep <- package_dependencies(packages= "rags2ridges", which = c("Depends", "Imports"), recursive = T) length(unlist(pack_dep)) |
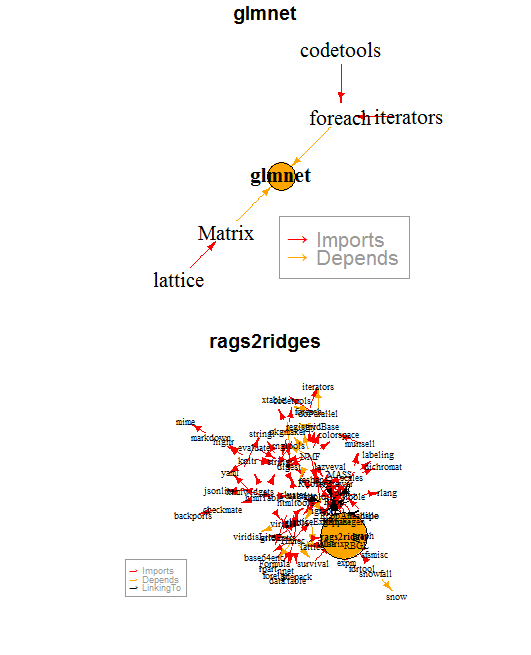
Another, cooler way, is to use the packages miniCRAN and igraph. Install them before you execute this code, to get the fancy visualization in zero time:
|
1 2 3 4 5 6 7 8 9 10 11 12 13 14 |
library("miniCRAN") library("igraph") glmnet_dep <- pkgDep("glmnet", enhances=F, suggests= F) rags2ridges_dep <- pkgDep("rags2ridges", enhances=F, suggests= F) # print(glmnet_dep) length(glmnet_dep) # print(glmnet_dep) length(rags2ridges_dep) rags2ridges_gra <- makeDepGraph("rags2ridges", enhances=F, suggests= F) glmnet_gra <- makeDepGraph("glmnet", enhances=F, suggests= F) plot(glmnet_gra, legendPosition = c(1, -1), vertex.size= 25, main="glmnet", cex = 1.3) plot(rags2ridges_gra, legendPosition = c(-1, -1), vertex.size= 45, main="rags2ridges", cex = 0.6) |

By this simple metric, I argue that the package glmnet is less fragile than the package rags2ridges.
Not to say you should now practice your avoidance skills. But keep it in the back of your mind. If it is something very important you can consider writing your own code, even if it is heavily relying on someone else’s code.


