Matlab has it this time, with solid 3D plotting capabilities.
Here is a figure of the Oil short end (until 12 months) term structure:
 This was generated very easily via:
% I assume you have CO, the matrix of prices loaded
% along with the time index
T = length(Time);
  matur = repmat([1:12]',1,T)';
  Time0 = repmat([Time]',12,1)';
  figure()
  surface(Time0,matur, CO)
datetick('x','yy','keepticks')
axis('tight')
rotate3d on
grid on
R produced less satisfactory result:
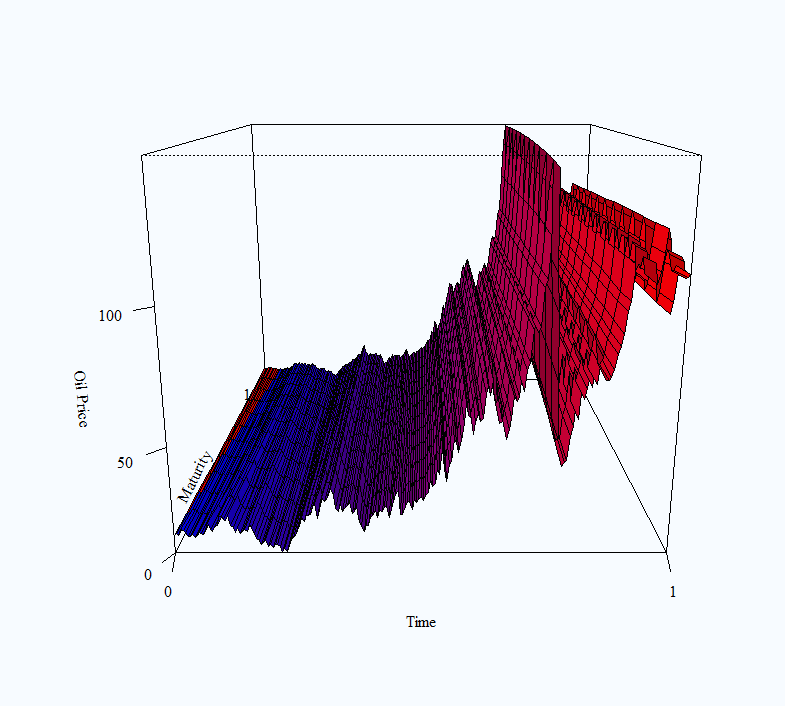 using the code:
# I assume you have 'dat' the matrix of prices loaded.
# Could not get the time index to show properly
colfunc <- colorRampPalette(c("blue", "red"))
# colfunc(10)
persp(dat, col= (colfunc(NROW(dat))),shade = 0.15,
ticktype = "detailed", nticks=2,
      xlab = "Time", ylab = "Maturity",
zlab = "Oil Price",d=1.2,expand = 0.8)
I have also played around with the rgl package which lets you rotate the figure to get a more holistic view, but was straggling to export the figure properly, tips appreciated.
Data for the figures can be found here


Try the Mathnium functions surf and surfl.
Similar to Matlab but free.
Hi Eran,
thanks for the post.
I’d like to replicate your results but I’m having difficulties loading the data in both: Matlab and R.
May I know what commands are required?
Thanks in advance
In order to replicate you can save the data as a txt file and use read.table to load it into R.
For Matlab, I actually pasted the cells into a variable so no formal command there but you can do the same. In order to create an Excel you can use write.table from R to write the file and then paste it to Matlab.
Dear Eran,
thanks for the hints. It worked with Matlab but unfortunately with R after using:
dat <-read.table("/Shared/OilCurve.txt")
I got the following error message:
Error in persp.default(dat, col = (colfunc(NROW(dat))), shade = 0.15, :
invalid 'x' argument
Any further suggestions?
Many thanks in advance,
Ruben
### Load Data
dat <- as.matrix(read.table(file = "../OilCurve.txt",header = F)[,2:13] ) ### PLot persp(dat,col=colfunc(NROW(dat)),shade = 0.15, ticktype = "detailed", nticks=2, xlab = "Time", ylab = "Maturity", zlab = "Oil Price",d=1.2,expand = 0.8) ## I hope this works for you, on my end it does.
Dear Eran,
please, can you post the data to replicate the figure in MATLAB?
Dropbox made some changes.. broken link now fixed.