This is the fifth post which is concerned with quantifying the dependence between variables. When talking correlations one usually thinks about linear correlation, aka Pearson’s correlation. One serious limitation of linear correlation is that it’s, well.. linear. By construction it’s not useful for detecting non-monotonic relation between variables. Here I share some recent academic research, a new way to detect associations that are not monotonic.
A seminal paper from 2011 “Detecting Novel Associations in Large Datasets” provides a nice peek into this thorny world of non-monotonic association measures. A recent, wonderfully written paper “A New Coefficient of Correlation” produces a new, assumption-free dependence measure which simple to understand, simple to compute and is theoretically sound. For the sake or brevity, references and formulas are below for those readers who wish a closer look. Here, lets just give this new correlation measure a whirl. Denote  as the new coefficient of correlation, and compare it to the familiar Pearson’s correlation denoted as
  . The left panel has
  as a noisy version of
  , so a parabolic relation. The right panel has as a noisy version of
  , so a linear relation.
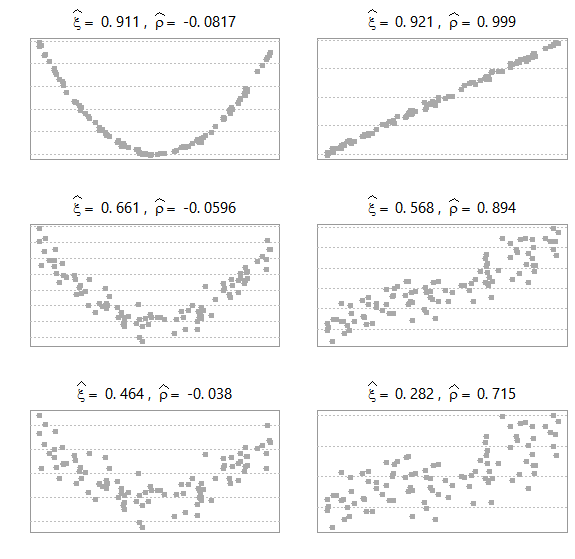
While the linear measure , as expected, is very low for the left panel, the new coefficient of correlation manages well to capture the non-linear relation. There is more to like. While the data becomes noisier as we move from top figures to the bottom ones, looking at the right panel the estimated decreases by not much compared with the estimated . A matter of taste I guess, but I myself find it easier to digest lower numbers on noisy data.
Few more comments before we adjourn here. The new coefficient of correlation :
 with
with  as they do usually for asymmetric metrics
References
Applied Multiple Regression/Correlation Analysis for the Behavioral Sciences

The actual formula (without ties) for the new coefficient of correlation:
![\[\xi_{n}(X, Y):=1-\frac{3 \sum_{i=1}^{n-1}\left|r_{i+1}-r_{i}\right|}{n^{2}-1}\]](https://eranraviv.com/wp-content/ql-cache/quicklatex.com-8980485af7d30d39c5c34aef283a45c0_l3.svg "Rendered by QuickLaTeX.com")
 is the rank of
  .
.


One comment on “Correlation and correlation structure (5) – a new coefficient of correlation”