Rivers of ink have been spilled over the ‘Bayesian vs. Frequentist’ dispute. Most of us were trained as Frequentists. Probably because the computational power needed for Bayesian analysis was not around when the syllabus of your statistical/econometric courses was formed. In this age of tablets and fast internet connection, your training does not matter much, you can easily transform between the two approaches, engaging the right webpages/communities. I will not talk about the ideological differences between the two, or which approach is more appealing and why. Larry Wasserman already gave an excellent review.
In practice, I am not sure there is big difference. I consider Bootstrap to be the Frequenist analogue for the Bayesian approach. The relation was pointed out already in 1981 by Donald Robin.
In the following toy example I apply both Bootstrap and Bayesian inference, and push forward the point that (Oy vey..) the choice between the two approached does not matter much.
The model for today is:
(1) 
n <- 100
x1 <- rnorm(n,0,3)
x2 <- rnorm(n,0,1)
cor(x1,x2)
normres <- rnorm(n,0,1)
tres <- rt(n,df=4)
y = 2 + 2*x1+4*x2+normres
y2 = 2 + 2*x1+4*x2+tres
The noise is simulated once from Normal and once from heavy tail t-dist.
Now we estimate the coefficients using Bayesian Regression and get their distribution.
Bayes_reg <- function(repet = 999, dependent, regressors) {
n <- NROW(regressors)
p <- NCOL(regressors)
xprimexI <- solve(t(regressors)%*%regressors)
lm0 <- lm(dependent~0+regressors)
start.value <- lm0$coef
sig=1/rgamma(repet,(n-p)/2,.5*t(lm0$res)%*%lm0$res)

bet <- matrix(NA,repet,p)
for(i in 1:repet) {
bet[i,]=start.value + t(rnorm(p,mean=0,sd=1))%*%chol(sig[i]*xprimexI)
}
return(list(b_hat = bet, lin_mod = lm0))
}
mod1 <- Bayes_reg(dependent=y, regressors=X) # Normal Residuals
mod2 <- Bayes_reg(dependent=y2, regressors=X) # Heavy tails Residuals (t with low df)
The function Bayes_reg is using Gibbs sampling – composition method.
Now Frequenist, using bootstrap:
bootbet <- function(repet=999,dependent, regressors){
	n <- NROW(regressors) ; p  <- NCOL(regressors)
beta_bootstrap <- matrix(NA,repet,p)
for (i in 1:repet){
unifnum = sample(c(1:n),n,replace = T)	# pick random indices
beta_bootstrap[i,] = lm(dependent[unifnum]~0+regressors[unifnum,])$coef
}
return(beta_bootstrap)
}
b_boot1 <- bootbet(dependent=y, regressors=X)
b_boot2 <- bootbet(dependent=y2, regressors=X) # for the heavy tailed residuals
Compare resulting distribution of the estimates. First the first coefficient:
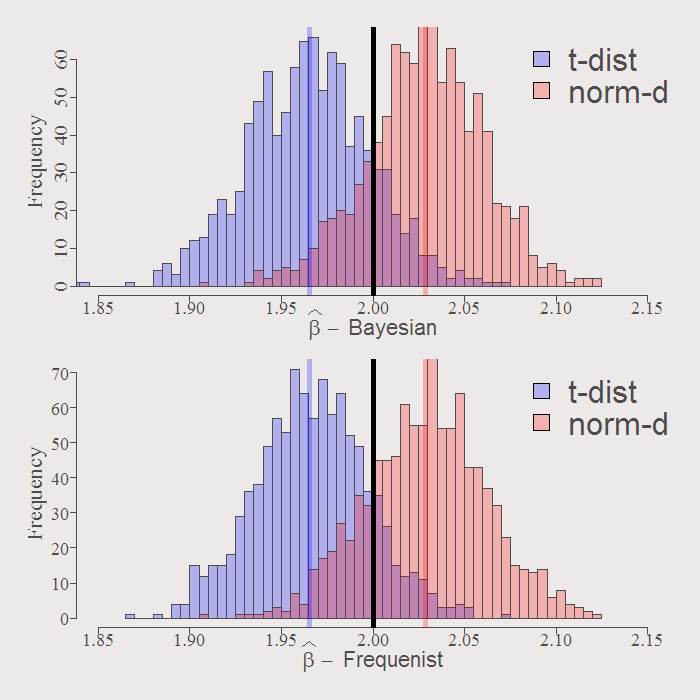
You can see how similar are the resulting distributions. The solid black line is the real value of the coefficient. By construction both Bayesian and Frequenist has the same center (around the OLS estimate when we have no prior guess) represented by the purple an orange solid lines. Whatever the distribution of the residuals, inference is going to be VERY similar. Examine the resulting actual Confidence Intervals of inference:
cat("Bayesian CI for norm-dist: [",format(quantile(mod1$b_hat[,l],.025),digits=5 ),"-",
format(quantile(mod1$b_hat[,l],.975),digits=5 ),"]","n" ,"Frequenist CI for norm-dist: [",format(quantile(b_boot1[,l],.025),digits=5 ),"-",
format(quantile(b_boot1[,l],.975),digits=5 ), "]","n" ,"----","n" ,"Bayesian CI for t-dist: [",format(quantile(mod2$b_hat[,l],.025),digits=5 ),"-",
format(quantile(mod2$b_hat[,l],.975),digits=5 ),"]","n" ,"Frequenist CI for t-dist: [",format(quantile(b_boot2[,l],.025),digits=5 ),"-",
format(quantile(b_boot2[,l],.975),digits=5 ),"]","n" )
l = 2 # First Coefficient
# Bayesian CI for norm-dist: [ 1.9646 - 2.0887 ]
# Frequenist CI for norm-dist: [ 1.9669 - 2.0947 ]
#-------
# Bayesian CI for t-dist: [ 1.9 - 2.0301 ]
# Frequenist CI for t-dist: [ 1.9051 - 2.0275 ]
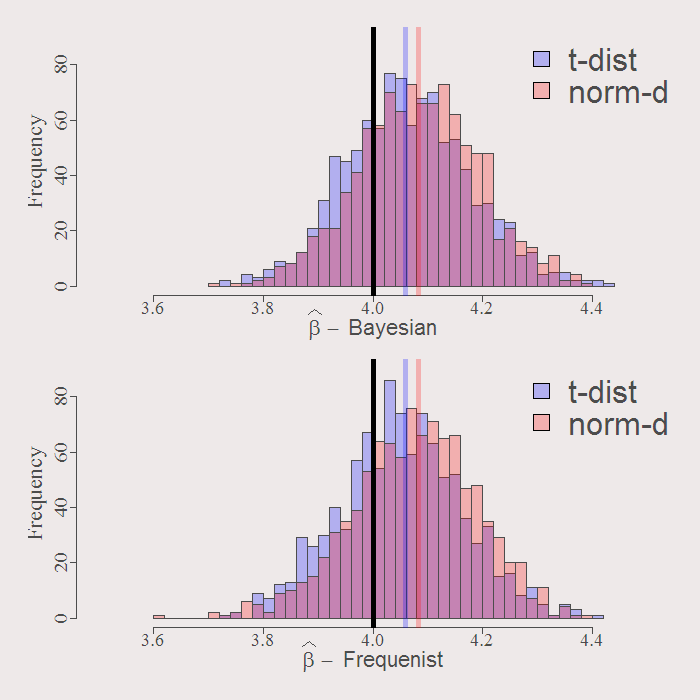
l = 3 # Second Coefficient
# Bayesian CI for norm-dist: [ 3.8621 - 4.3001 ]
# Frequenist CI for norm-dist: [ 3.8358 - 4.2786 ]
#-------
# Bayesian CI for t-dist: [ 3.8461 - 4.2926 ]
# Frequenist CI for t-dist: [ 3.8279 - 4.2803 ]
The confidence interval differ only slightly. So despite the ideological differences (“What do you exactly mean by the distribution of the parameters???, what kind of statistician are you??”), when it comes to inference in this toy example, distinguishing between the two approaches is not worth the effort.
Conclusion, don’t be a Bayesian, nor be a Frequenist, be opportunist. Do whatever you find is easier. My intuition is that they the two approaches yield very different results only in a carefully constructed scenarios.
Appendix:
Code for Figures:
par(mfrow = c(2,2))
# Graphical Parameters:
col1 <- rgb(0,0,1,1/4)
col2 <- rgb(1,0,0,1/4)
lwd1 <- 5

bet_expression1 <- bquote(Histogram~of ~bold(widehat(beta))~1)
bet_expression2 <- bquote(Histogram~of ~bold(widehat(beta))~2)
# Bayesian
hist(mod2$b_hat[,2],breaks = 44, col=col1, main =  bet_expression1, xlim = c(1.85,2.25),
	xlab = bquote(widehat(beta)) )
hist(mod1$b_hat[,2], breaks = 44, add = T, col=col2)
abline(v=mod2$lin_mod$coef[2], col = col1, lwd = lwd1)
abline(v=mod1$lin_mod$coef[2], col = col2, lwd = lwd1)
legend("topright", c("t-dist", "norm-dist"), fill=c(col1, col2), bty = "n")

hist(mod2$b_hat[,3],breaks = 44, col=col1, main = bet_expression2, xlim = c(3.5,4.5),
	ylim = c(0,90), xlab = bquote(widehat(beta)) )
hist(mod1$b_hat[,3], breaks = 44, add = T, col=col2)
abline(v=mod2$lin_mod$coef[3], col = col1, lwd = lwd1)
abline(v=mod1$lin_mod$coef[3], col = col2, lwd = lwd1)
abline(v=4, col = 1, lwd = lwd1)
legend("topright", c("t-dist", "norm-dist"), fill=c(col1, col2), bty = "n")

#### Frequenist
hist(b_boot2[,2],breaks = 44, col=col1, main =  bet_expression1, xlim = c(1.85,2.25),
	xlab = bquote(widehat(beta)) )
hist(b_boot1[,2], breaks = 44, add = T, col=col2)
legend("topright", c("t-dist", "norm-dist"), fill=c(col1, col2), bty = "n")

abline(v=mod1$lin_mod$coef[2], col = col2, lwd = lwd1)
abline(v=mod2$lin_mod$coef[2], col = col1, lwd = lwd1)
abline(v=2, col = 1, lwd = lwd1)
legend("topright", c("t-dist", "norm-dist"), fill=c(col1, col2), bty = "n")

hist(b_boot2[,3],breaks = 44, col=col1, main =  bet_expression2, xlim = c(3.5,4.5),ylim = c(0,90),
xlab = bquote(widehat(beta)) )
hist(b_boot1[,3], breaks = 44, add = T, col=col2)
legend("topright", c("t-dist", "norm-dist"), fill=c(col1, col2), bty = "n")

abline(v=mod1$lin_mod$coef[3], col = col2, lwd = lwd1)
abline(v=mod2$lin_mod$coef[3], col = col1, lwd = lwd1)
abline(v=4, col = 1, lwd = lwd1)


One comment on “Bayesian vs. Frequentist in Practice”