Especially for undergraduate students but not just, the concepts of unbiasedness and consistency as well as the relation between these two are tough to get one’s head around. My aim here is to help with this. We start with a short explanation of the two concepts and follow with an illustration.
Unbiased estimator means that the distribution of the estimator is centered around the parameter of interest:
![\[E(estimator) = parameter\]](https://eranraviv.com/wp-content/ql-cache/quicklatex.com-ed07fcf7ffb45ef84b58fde617605bd1_l3.svg "Rendered by QuickLaTeX.com")
for the usual least square estimator this means that  . Note this has nothing to do with the number of observation used in the estimation.
Explanation
Better to explain it with the contrast: What does a biased estimator mean?
An estimator depends on the observations you feed into it. For instance,  depends on the sample (X,y). For different sample, you get different estimator
  . This means that the number you eventually get has a distribution. I think this is the biggest problem for graduate students. Most of them think about the average as a constant number, not as an estimate which has it’s own distribution. The average is sample dependent, and the mean is the real unknown parameter and is constant (Bayesians, keep your cool please), this distinction is never sharp enough.
A biased estimator means that the estimate we see comes from a distribution which is not centered around the real parameter. Why such estimators even exist? Why shouldn’t we correct the distribution such that the center of the distribution of the estimate exactly aligned with the real parameter? The answer is that the location of the distribution is important, that the middle of the distribution falls in line with the real parameter is important, but this is not all we care about. Our estimate comes from the single realization we observe, we also want that it will not be VERY far from the real parameter, so this has to do not with the location but with the shape.
Sometimes we are willing to trade the location for a ‘better’ shape, a tighter shape around the real unknown parameter. Imagine an estimator which is not centered around the real parameter (biased) so is more likely to ‘miss’ the real parameter by a bit, but is far less likely to ‘miss’ it by large margin, versus an estimator which is centered around the real parameter (unbiased) but is much more likely to ‘miss’ it by large margin and deliver an estimate far from the real parameter. You see, we do not know what is the impact of interest rate move on level of investment, we will never know it. We only have an estimate and we hope it is not far from the real unknown sensitivity. That is why we are willing to have this so-called bias-variance tradeoff, so that we reduce the chance to be unlucky in that the realization combined with the unbiased estimator delivers an estimate which is very far from the real parameter.
What does Consistency mean?
Maybe the estimator is biased, but if we increase the number of observation to infinity, we get the correct real number. Note that this concept has to do with the number of observations. For example the OLS estimator is such that (under some assumptions):
![\[\lim_{n \rightarrow \infty} pr(\vert \widehat{\beta} - \beta \vert) < \varepsilon = 0,\]](https://eranraviv.com/wp-content/ql-cache/quicklatex.com-a9a5c6b15da0fad38d605bf3b744f96d_l3.svg "Rendered by QuickLaTeX.com")
meaning that it is consistent, since when we increase the number of observation the estimate we will get is very close to the parameter (or the chance that the difference between the estimate and the parameter is large (larger than epsilon) is zero). A mind boggling venture is to find an estimator that is unbiased, but when we increase the sample is not consistent (which would essentially mean that more data harms this absurd estimator).
Now, we have a 2 by 2 matrix,
1: Unbiased and consistent
2: Biased but consistent
3: Biased and also not consistent
4: Unbiased but not consistent
(1) In general, if the estimator is unbiased, it is most likely to be consistent and I had to look for a specific hypothetical example for when this is not the case (but found one so this can’t be generalized).
(2) Not a big problem, find or pay for more data
(3) Big problem – encountered often
(4) Could barely find an example for it
Illustration
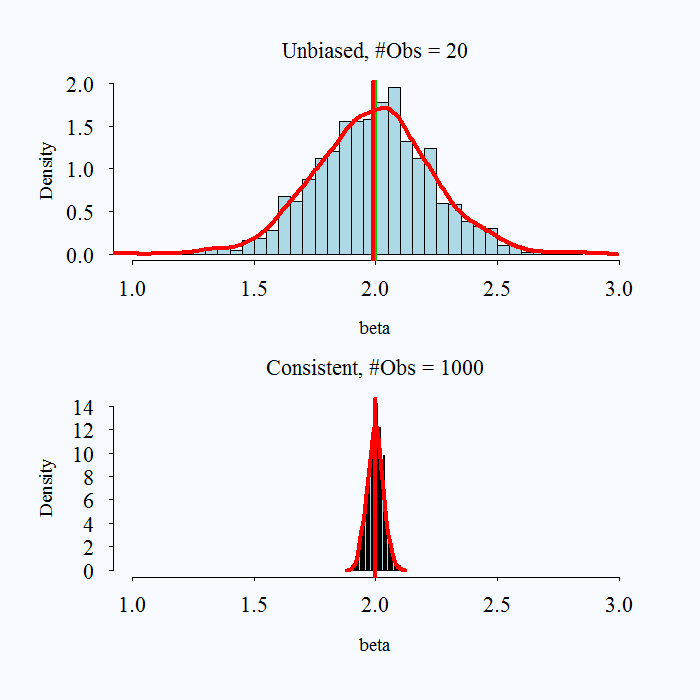
Hopefully the following charts will help clarify the above explanation. The real parameter is set to 2 in all simulations, and is always represented by the green vertical line. The red vertical line is the average of a simulated 1000 replications.
1: Unbiased and Consistent
|
1 2 3 4 5 6 7 8 9 10 11 12 13 14 15 16 17 18 19 20 21 22 |
### Unbiased and Consistent repet <- 1000 TT <- 20 beta <- NULL for (i in 1:repet){ x <- rnorm(TT) eps <- rnorm(TT,0,1) y=2+2*x+eps beta[i] <- lm(y~x)$coef[2] } histfun(beta, mainn= "Unbiased") TT <- 1000 beta <- NULL for (i in 1:repet){ x <- rnorm(TT) eps <- rnorm(TT,0,1) y=2+2*x+eps beta[i] <- lm(y~x)$coef[2] } histfun(beta,mainn="Consistent") |
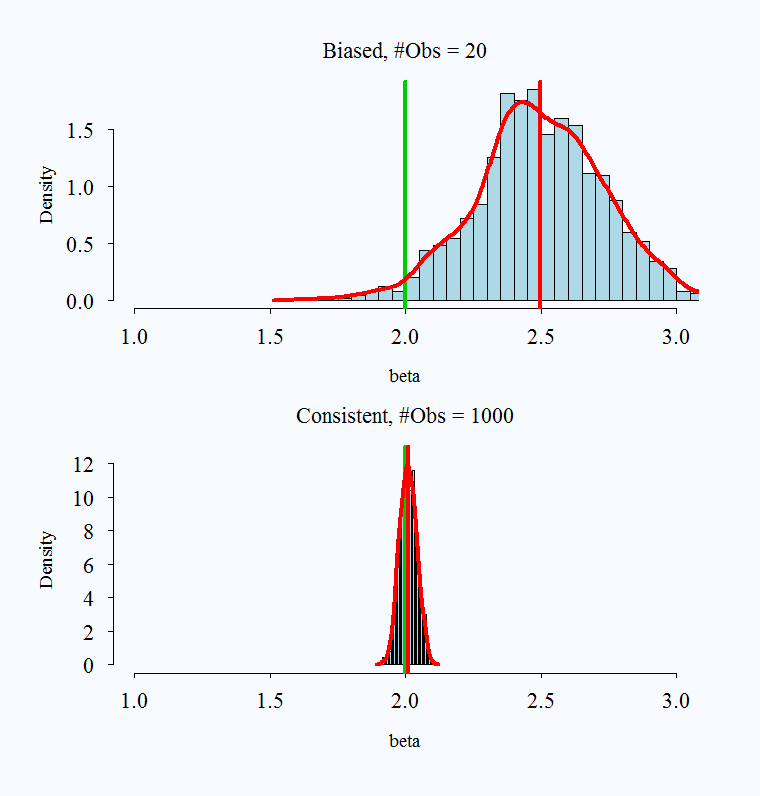
2: Biased but consistent
|
1 2 3 4 5 6 7 8 9 10 11 12 13 14 15 16 17 18 19 20 |
### Biased But Consistent TT <- 20 beta <- NULL for (i in 1:repet){ x <- rnorm(TT) eps <- rnorm(TT,0,1) y=2+2*x+eps beta[i] <- (10/TT)+lm(y~x)$coef[2] # Text book example } histfun(beta,mainn="Biased") TT <- 1000 for (i in 1:repet){ x <- rnorm(TT) eps <- rnorm(TT,0,1) y=2+2*x+eps beta[i] <- (10/TT)+lm(y~x)$coef[2] } histfun(beta,mainn="Consistent") |
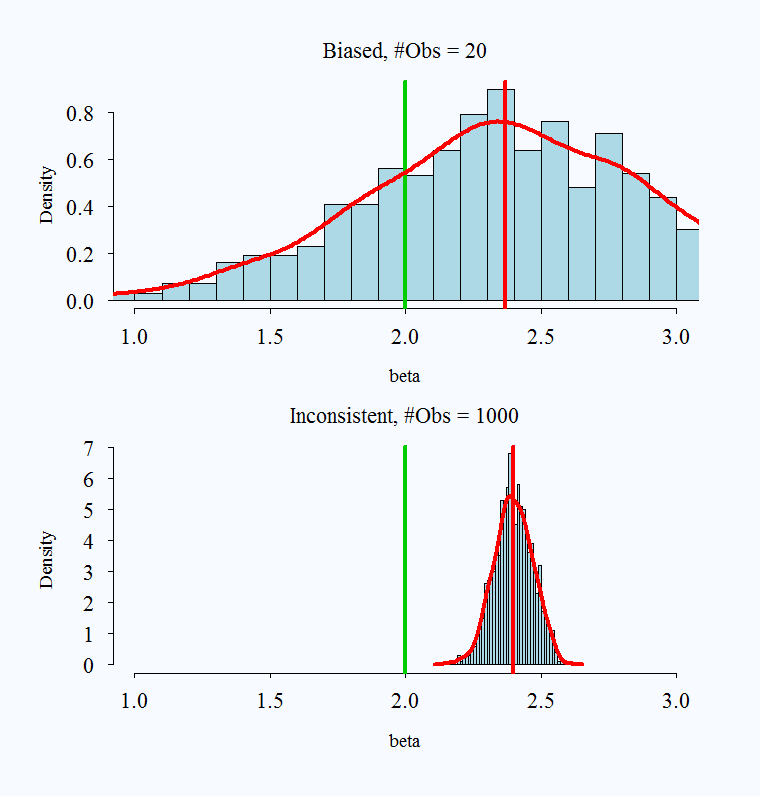
3: Biased and also not consistent, omitted variable bias
|
1 2 3 4 5 6 7 8 9 10 11 12 13 14 15 16 17 18 19 20 21 22 23 |
### Omitted Variable Bias: Biased and Inconsistent TT <- 20 beta <- NULL for (i in 1:repet){ x <- rnorm(TT) x2 <- rnorm(TT)+.2*x # make it correlate a bit with x eps <- rnorm(TT,0,1) y=2+2*x+2*x2+eps beta[i] <- lm(y~x)$coef[2] # I do not include x2 } histfun(beta,mainn="Biased") TT <- 1000 beta <- NULL for (i in 1:repet){ x <- rnorm(TT) x2 <- rnorm(TT)+.2*x eps <- rnorm(TT,0,1) y=2+2*x+2*x2+eps beta[i] <- lm(y~x)$coef[2] } histfun(beta,mainn="Inconsistent") |
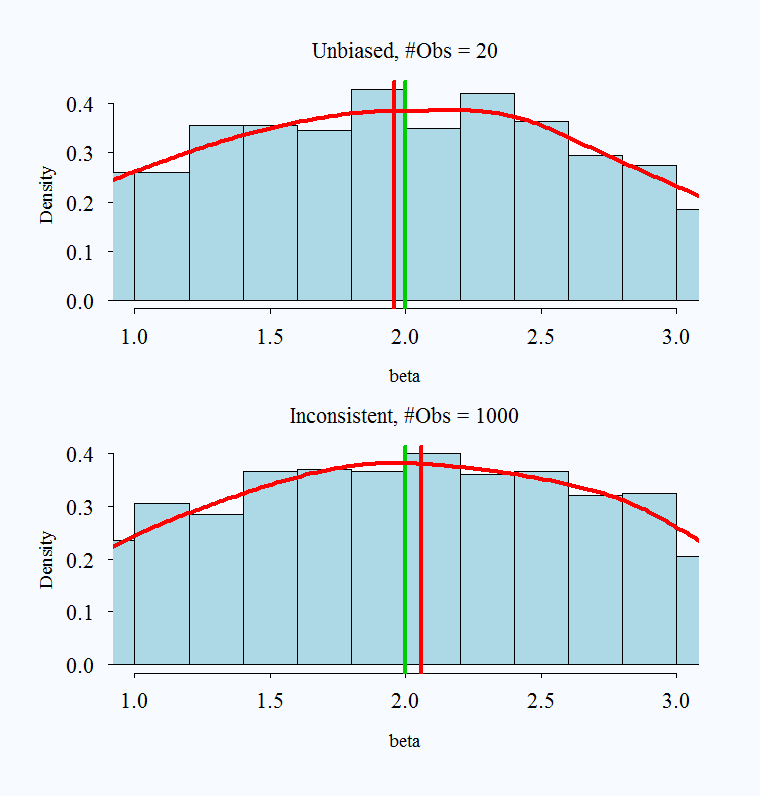
4: Unbiased but not consistent – idiotic textbook example – other suggestions welcome
|
1 2 3 4 5 6 7 8 9 10 11 12 13 14 15 16 17 18 19 |
### Unbiased But Inconsistent - Only example I am familiar with # Other examples welcome TT <- 20 beta <- NULL for (i in 1:repet){ x <- rnorm(TT,2,1) y = x beta[i] <- y[1] } histfun(beta,mainn="Unbiased") TT <- 1000 for (i in 1:repet){ x <- rnorm(TT,2,1) y = x beta[i] <- y[1] # Ignore the effect of having Large TT } histfun(beta,mainn="Inconsistent") |
Appendix
Just a word regarding other possible confusion. Papers also use the term ‘consistent’ in regards to selection criteria. Selection criteria deliver estimate but for a structure, e.g. exact number of lags to be used in a time series. In those cases the parameter is the structure (for example the number of lags) and we say the estimator, or the selection criterion is consistent if it delivers the correct structure. For example the AIC does not deliver the correct structure asymptotically (but has other advantages) while the BIC delivers the correct structure so is consistent (if the correct structure is included in the set of possibilities to choose from of course). An even greater confusion can arise by reading that “LASSO is consistent”, since LASSO delivers both structure and estimates so be sure you understand what do the authors mean exactly.
Code needed in the preamble if you want to run the simulation.
|
1 2 3 4 5 6 7 8 9 10 11 |
histfun <- function(what,breaks=44,mainn,xlim=c(1,3)){ cexx=1.4;lwdd=4 hist(beta,breaks=44,freq=F,xlim=c(1,3),main=paste(mainn, ", #Obs = ", TT,sep=""), cex.axis=cexx,cex.main=cexx,cex.lab=cexx-.2,col='lightblue') den <- density(what) abline(v=2,col=3,lwd=lwdd) abline(v=mean(what),col=2,lwd=lwdd) lines(den,col=2,lwd=lwdd) } |


Thanks, it wouldn’t have been clearer
This is an amazing website!
I also found this example for (4), from Davidson 2004, page 96
yt=B1+B2*(1/t)+ut with idd ut has unbiased Bs but inconsistent B2.
also
mu=0.01*y1 + 0.99/(n-1) sum_{t=2}^n*yt
In the book I have it on page 98. Yeah, nice example. Thanks for this.
Thanks so much, this is helpful
Thank you a lot, everything is clear. The unique thing I can’t get is what is “repet” you used in the loop for in the R code…
Repetfor repetition: number of simulations.Thank you very much! The graphics really bring the point home
Thanks for your works, this is quite helpful for me.
Thank you, that is the idea.
limit n -> infinity, pr|(b-b-hatt)| = 1 in figure is wrong. It should be 0.
Thank you – corrected.
histfun says not found? is there any library i should install first?
Search for “Code needed in the preamble if you want to run the simulation.” the function code is in the post
Thanks for the great explanation. May I recommend using colorblind-friendly colors? Red+green is confusing to many folks. Red+blue would be a safer bet. Thanks!
Thank you. I will!