In a previous post I underlined an inherent feature of the non-parametric Bootstrap, it’s heavy reliance on the (single) realization of the data. This feature is not a bad one per se, we just need to be aware of the limitations. From comments made on the other post regarding this, I gathered that a more concrete example can help push this point across.
Say we want to estimate the distribution of the maximum (maybe you are developing a statistical test to identify whether an observed price move is the maximum or not yet..). Let’s see what happens with a non-parametric Bootstrap and compare it with a parametric one.
Suppose now the distribution of the average price move within a day is 5, and that the move follows a uniform distribution between 1:10.
In the simulation settings we first simulate a single realization using this setting and treat is as ‘real’. Then we draw from this one single realization in the non-parametric settings. In the parametric setting we assume the correct distribution and so we draw from uniform, which is here the correct Data Generating Process.
maxx <- 10
Nobs <- 78 # number of 5 mins bars in a trading day
# Get the "real" value:
realization <- runif(Nobs,1,maxx)
 max(realization) # I have it at 9.89
repet <- 1000 # number of draws
Pboot  <- NPboot <- matrix(nrow=Nobs,ncol=repet)
for (i in 1:repet){
NPboot[,i] <- sample(realization,Nobs,replace=T) # non-parametric
Pboot[,i] <- runif(Nobs,1,maxx) # we know this is the correct parametric form
}
Now we plot the result:
par(mfrow = c(2,1))
plot(apply(NPboot,2,max),ylim=c(8,10),pch=19,xlab="",ylab="",
main="Draws of the Maximum",cex.main=2,cex.axis=1.4)
points(apply(Pboot,2,max),col=rgb(0,1,0,.2),pch=19)
legend('bottomleft',c('Non-Parametric','Parametric'),pch=19,
text.col=c(1,3),col=c(1,3),bty="n",cex=2)
hist(apply(NPboot,2,max),breaks=44,col='black',xlim=c(9:10),ylab="",
     xlab="",main="Histogram of the Maximum",cex.main=2,cex.axis=1.4)
hist(apply(Pboot,2,max),col=rgb(0,1,0,.2),add=T,breaks=44,xlab="",
xlim=c(9:10))
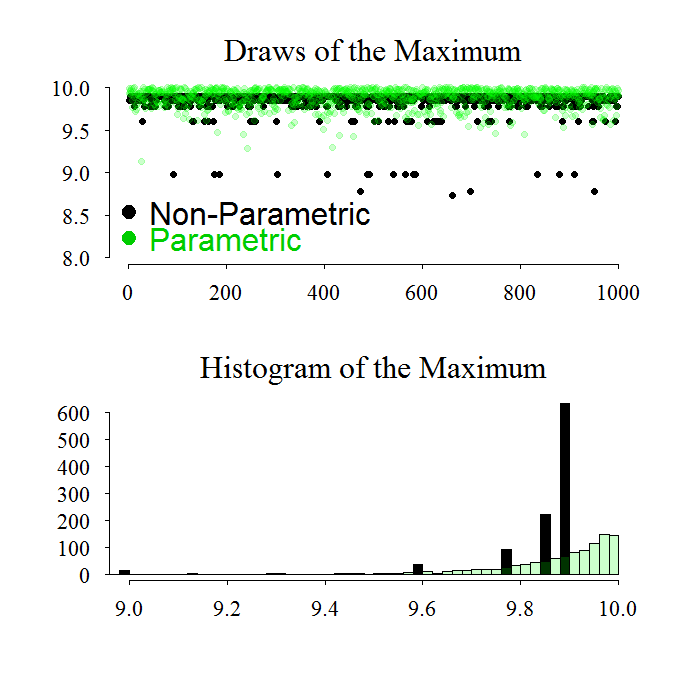
We see perfectly well what is the problem here. There is no chance to draw above the ‘observed’ maximum (the one from that realization that is treated as real), and we have about 4 mass points which messes up the distribution. By adding assumptions, for example that the process is uniform, we get closer to the real unknown distribution. Indeed, in reality we do not know what is the real distribution to draw from, but sometimes even only an ok guess will be much better than relying fully on the observed data.
Bayesian +1, Fishers 0.
Related:


