Recently, volatility has been on the up. Generally, we associate rising volatility with a bear regime, but we also know there is a percolating oil shock. Is the volatility we see in the stock market broad-based, or is it the effect brought about by sharp the drop in oil prices (so related to the energy sector)? I propose here a practical way to take a closer look at it.
Start by pulling the data (ETFs of the different sectors) and construct volatility estimates:
library(quantmod)
library(rugarch)
library(lawstat)
k <- 10 # how many years back?
end<- format(Sys.Date(),"%Y-%m-%d")
start<-format(Sys.Date() - (k*365),"%Y-%m-%d")

symetf = c('XLY','XLP','XLE','XLF','XLV','XLI','XLB','XLK','XLU','SPY','^VIX')
l <- length(symetf)
dat0 = getSymbols(symetf[1], src="yahoo", from=start, to=end, auto.assign = F, warnings = FALSE,symbol.lookup = F)
n = NROW(dat0)  ; l = length(symetf)
dat = array(dim = c(n,NCOL(dat0),l)) ; ret = matrix(nrow = n, ncol = l)
for (i in 1:l){
  dat0 = getSymbols(symetf[i], src="yahoo", from=start, to=end, auto.assign = F,warnings = FALSE,symbol.lookup = F)
  dat[1:n,,i] = dat0
  ret[2:n,i] = dat[2:n,4,i]/dat[1:(n-1),4,i] - 1 # returns
}
time <- as.Date(substr(index(dat0),1,10))[-1] # get the time index and remove first obs

#**** Construct volatility estimates - gotta love R
kk <- 9
gjrtspec <- ugarchspec(mean.model=list(armaOrder=c(1,0)),variance.model =list(model = "gjrGARCH"),distribution="std")
volatility_fit <- matrix(nrow=(n-1),ncol=kk)
for (i in 1:kk){
  Tgjrmodel = ugarchfit(gjrtspec,ret[-1,i])
  volatility_fit[,i] = as.numeric(sigma(Tgjrmodel))
  }
#**** Plot the result
z <- 120 # zoom in on recent 120 days
par(mfrow = c(1,1))
matplot(100*tail(volatility_fit,z),ty="l",ylab="SD",col=1:10,lwd=2, xlab="Time (days)")
grid()
legend("topleft",paste(symetf[1:kk]),bty="n",ncol=4,col=1:kk,lty=1:kk,text.col=1:kk,
       lwd=3)
title("Volatility pattern for the different sectors")
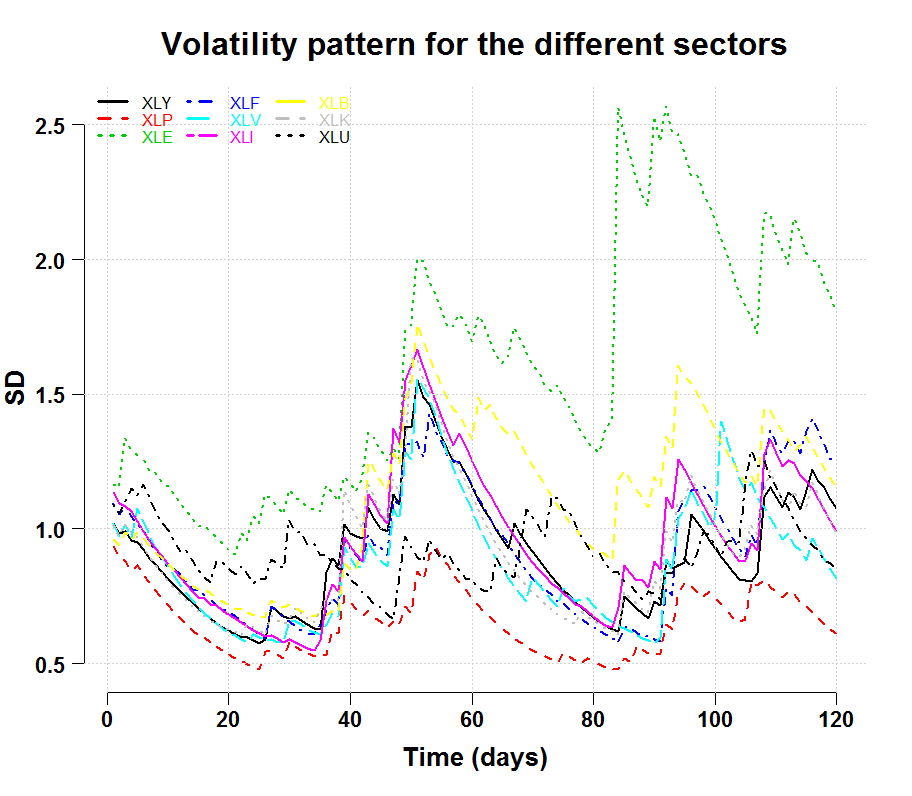
We see (1) Energy sector (XLE) is indeed in a disconnect from the rest and (2) the XLP ETF, which offers exposure to companies which manufacture products with low household demand elasticity, is indeed showing off it's defensive nature. As an aside you can see the average cross correlation is increased as well.
Now, with the aim of analyzing if the energy volatility is contagious or not, we can summarize the volatility matrix using PCA, once with the energy vector and once without. We can look at the first PC from the two decompositions and see if there is a difference. If there is not much difference, it would mean the removal of the energy component (or the addition thereof) is not material to the overall volatility and that volatility is broad-based.
 pca1 <- prcomp(tail(volatility_fit,z)) # All of the sectors
 pca2 <- prcomp(tail(volatility_fit[,c(symetf[onlysectors]!="XLE")],z)) # Exclude Energy
 summary(pca1)$importance[3,1]
 0.70183
 summary(pca2)$importance[3,1]
 0.83101
# Check the difference between the two first PC's
#	F test to compare two variances
var.test(pca1$x[,1],pca2$x[,1])
F = 1.2938, num df = 119, denom df = 119, p-value = 0.1615
alternative hypothesis: true ratio of variances is not equal to 1
So, we see that the first PC from the PCA which includes the energy sector, has lower explanatory power on the whole matrix; when we remove the energy sector, the first PC is much happier, with larger explanatory power (meaning it manages to better capture the comovement between the volatility series). Using a simple F test we can check if the difference is statistically meaningful. It is possible since the "importance" is simply the variance of the first PC. This test has low power so I would not read too much into it, but it is indicative.
Something to think about that next time the VIX is above 25.


