Random Forests (RF from here onwards) is a widely used pure-prediction algorithm. This post assumes good familiarity with RF. If you are not familiar with this algorithm, stop here and see the first reference below for an easy tutorial. If you used RF before and you are familiar with it, then you probably encountered those “importance of the variables” plots. We start with a brief explanation of those plots, and the concept of importance scores calculation. Main takeaway from the post: don’t use those importance scores plots, because they are simply misleading. Those importance plots are simply a wrong turn taken by our human tendency to look for reason, whether it’s there or it’s not there.
This post is inspired by the most recent, beautiful and stimulating (as usual) paper by Prof. Bradley Efron: Prediction, Estimation, and Attribution (linked below).
Contents
How variable importance is calculated?
There is more than one way to calculate variable importance score. Here is just one common way which is called mean decrease in node impurity. Since we will be busy with a classification problem in the empirical example, node impurity will be measured by the Gini criterion (see appendix for formal definition).
Once the RF algorithm took its course, for each (bootstrapped) tree we have a list of splits. Each such split has a one-to-one mapping with a particular variable which was chosen for it. We can then sum up all the decreases in the Gini criterion over all splits, per variable, and average that number over all (bootstrapped) trees which were constructed. Normalize those numbers and you have the importance score per variable. The rationale behind this procedural calculation is that if the algorithm chooses some variables often, and splits are taken based on those variables display large “progress” towards a good solution-i.e large drop in node impurity, it stands to reason that those variables are “important”. Super intuitive I admit. I myself have strayed based on this intuition. If you run the code given in the help files for the function varImpPlot you can see a typical variable importance plot I am referring to:
|
1 2 3 4 5 6 7 |
set.seed(4543) data(mtcars) mtcars.rf <- randomForest(mpg ~ ., data=mtcars, ntree=100, keep.forest=FALSE, importance=TRUE) varImpPlot(mtcars.rf, type= 1, pch=19, main="") |
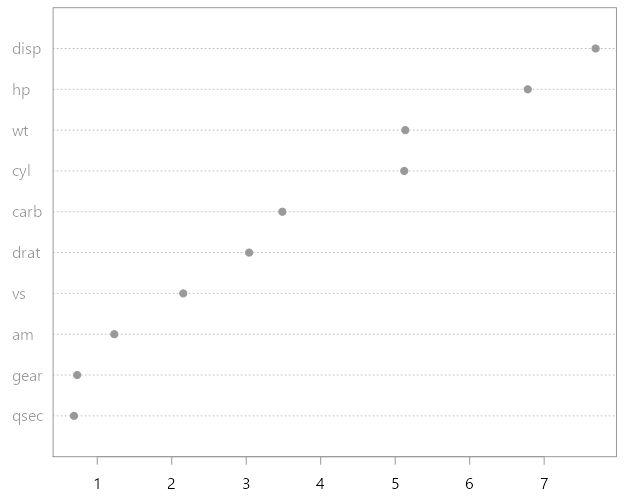
What you see is a ranking of the individual variables according to their importance (measured as explained above). The variable disp is the most important variable according to this plot.
What seems to be the problem officer?
Prediction is much easier than attribution. The default modus operandi of those pure-prediction algorithms is nonparametric. Those algorithms are permissive in the sense that you don’t need to powerful explanatory variables. This is key. Pure-prediction algorithm can do very well with what is sometimes referred to as “weak learners” or “inefficient” explanatory variables; as long as you have enough of those. Prediction from pure-prediction algorithm is accurate, not so much because of a specific/particular variable, but because of the interim non-linear transformation which includes many variables. Plots which show relative “importance measure”- a the result of numerical computation done on random subsets on the algorithm’s path towards prediction- falesly award a feel of absolute importance. That is misleading. Let’s hammer this further.
Empirical exercise
Data for this exercise is taken from the sda package in R. It contains measurement from genetic expression levels of 6033 genes for 102 people (so matrix dimension is  ). 52 people are cancer patients and 50 people are normal controls. The goal is to apply RF to predict whether a patients are healthy or sick based on their microarray measurements.
I split the data into training set (70%) and test set (30%). Using the default values of the randomForest function (from the package by the same name) I estimate a RF model. The first plot shown here is actually the second plot I generated (the first plot comes after the second in a few seconds).
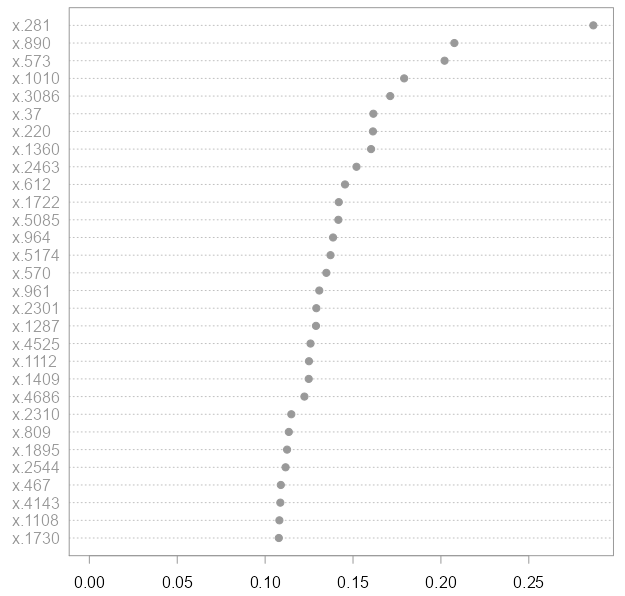 The accuracy achieved is excellent: all test cases are predicted correctly. The plot above depicts the genes which helped the most in achieving this good accuracy. The plot was generated using the
 varImpPlot from the same package. Gene 281 was the most helpful followed by the duo 890 and 574 etc. So, are those genes important? Not at all!
This is the first plot I generated:
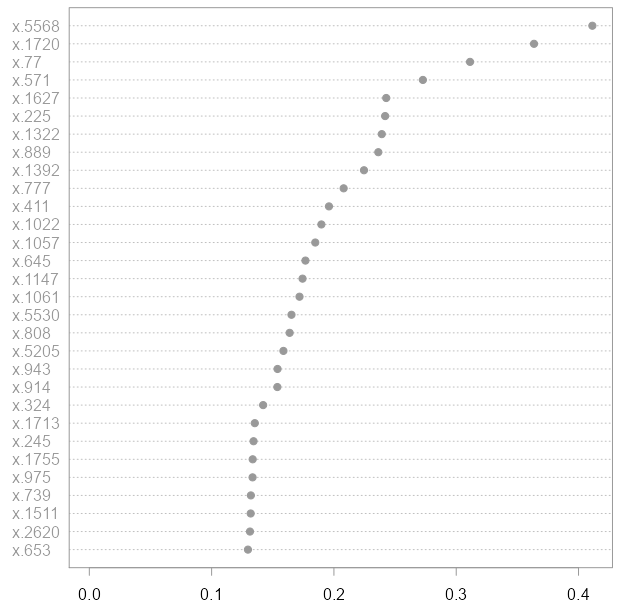 Here you can see that genes numbers 5568, 1720, 77 etc. are helpful. The accuracy of this model is, again, 100%.
Importantly, the first plot you saw was generated after I removed those 30 genes plotted above (numbers 5568, 1720, 77 etc.). We have obtained a similar plot with interesting genes without any loss in accuracy. You see, it’s relative importance, while in the second model, after we removed the top 30 most helpful variables from the first model, you would find gene number 281 worth looking into, while the same Gene did not even appear in the top 30 interesting genes when we used the full microarray set. While I think 30 is enough to make the point, I started experimenting with values of 10, 20, and stopped at 30. You can even remove an additional subsequent 30 variable from the RF model and I think you will still not suffer any accuracy loss.
Bigger picture
The complicated nonlinear transformation of the variables is in command over the excellent accuracy, not individual variables. While you can certainly rank the variables based on the numerical procedure we outlined above and zoom on those variables which rank high, we should altogether carve out the term “important” when looking at the original variables in that way. In my opinion that was an unfortunate choice of words for those plots.
We have discussed RF in this post. However, in the field of explainable AI there is a research trend which tries to revert back to the original variables. While I fully understand the temptation, whether there are or there aren’t strong explanatory variables, that is not the way to go about it. It is not the way to go about it because of the way those black-box algorithms inner-work. For explicability’s sake, at my work I proposed to introduce the concept of “grey box”, which says something about the inner-workings of the algorithms, the numerical procedures followed; rather than attempting to backtrack towards the original explanatory variables/features. We need to stop that.
References
Code
|
1 2 3 4 5 6 7 8 9 10 11 12 13 14 15 16 17 18 19 20 21 22 23 24 25 26 27 28 29 30 31 32 33 34 35 36 37 38 |
library(sda) library(randomForest) data(singh2002) dat0 <-singh2002 TT <- length(dat0$y) set.seed(654654) in_samp <- sample(c(1:TT),0.7*TT) out_samp <- c(1:TT)[-in_samp] train_dat <- data.frame(y= dat0$y[in_samp], x= dat0$x[in_samp,] ) test_dat <- data.frame(y= dat0$y[out_samp], x= dat0$x[out_samp,] ) num_import <- 30 model_rf <- randomForest(train_dat$y ~., data= train_dat) imp_var <- importance(model_rf, type= 2) tmp1 <- tail(imp_var %>% order, num_import) tmp2 <- tail(imp_var %>% sort, num_import) pdfpar(leftt=4, rowss=1) # barplot( sort(tmp2), horiz= T, names.arg= tmp1 , space=0.05,col= e_col[3]) varImpPlot(model_rf, main="", pch=19, n.var= num_import) rf_p <- predict(model_rf, newdata= test_dat[,-1], type= "response") 1 - sum( as.numeric(test_dat[,1]) - as.numeric(rf_p) )/length(out_samp) # remove "important" variables train_dat <- data.frame(y = dat0$y[in_samp], x = dat0$x[in_samp, -tmp1]) test_dat <- data.frame(y = dat0$y[out_samp], x = dat0$x[out_samp, -tmp1]) model_rf <- randomForest(train_dat$y ~ ., data = train_dat) imp_var <- importance(model_rf, type = 2) tmp1 <- tail(imp_var %>% order, num_import) tmp2 <- tail(imp_var %>% sort, num_import) varImpPlot(model_rf, main="", pch=19, n.var= num_import) rf_p <- predict(model_rf, newdata = test_dat[, -1], type = "response") 1 - sum(as.numeric(test_dat[, 1]) - as.numeric(rf_p)) / length(out_samp) |
Appendix
Gini’s criterion
Designed for classification.
![\[\text { Gini }=1-\sum_{j} p_{j}^{2},\]](https://eranraviv.com/wp-content/ql-cache/quicklatex.com-f71f6995fd1d81f36e140b11506d0523_l3.svg "Rendered by QuickLaTeX.com")
where  is the
  th entry in the vector of class-estimated probabilities.


Thanks for the insightful post. You may be interested by a very recent theoretical work on the Mean Decrease Impurity, which helps understand its flows : https://arxiv.org/abs/2001.04295.
Thank you.