It is a fact that on most days, not much is going on in the stock market. When we estimate the relation of a stock with the market, or the “beta” of a stock, we use all available daily returns. This might not be wise as some days are not really typical and contaminate our estimate. For example, Steve Jobs past away recently, AAPL moved quite a bit as a result. However, this is a distinct event that does not reflect on the relation with the market, but is company specific. Our aim is to exclude such observations, taking into consideration that we don’t want to lose too much information, not all large swings are irrelevant.
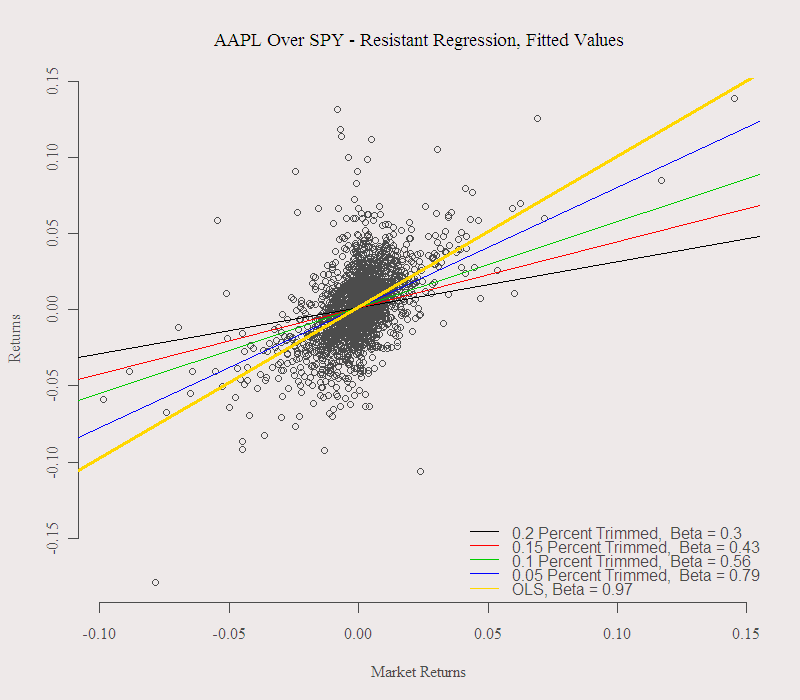
these kind of issues fall under the category of Robust Statistics. I already discussed how we can “robustify” our estimate for beta using Robust Regression. I recently read about a different approach bearing the fancy name Resistant Regression. The idea is to chop off the upper and lower 25% and to use only the inter-quartile range for estimation. For the financial markets, this approach produces results that are too robust, we don’t want to kick out so much information. I figure we can apply something in between. The following figure shows what happens when we chop off less than 25% (as in the original function: lqs in the package MASS). Take a look at the following picture, I use returns of AAPL (apple) and of SPY (S&P) for this example:

The more you trim, the lower the “beta”, which means that on quiet days the stock movement is more what we call idiosyncratic, or more independent from the market, relative to the whole sample. When we do not trim at all, the approach boils down to the standard OLS estimate, which is about one for Apple.
As I mentioned before, we don’t want to trim too much, not to lose too much information. Another idea is to kick out just those days, not when the stock moves too sharply, but when only the stock moves too sharply. We can scan the returns to find the days when the stock moved sharply while the market did not (which will indicate an idiosyncratic move). In my analysis I did not care what the market did those days, so I probably omitted observations that should have been included, specifically where AAPL was swinging but also SPY was swinging, but that is an easy fix to those who wish to implement this idea.
As Always, code and references are below, thanks for reading.
References: [asa onelinertpl]0471488550[/asa]
[asa onelinertpl]0471930946[/asa]
Code:
The function for Resistant Regression takes as default the vectors that I used in the post, but you can change it to any other time series. The last argument is how much you wish to “chop off”.
|
1 2 3 4 5 6 7 8 9 10 11 12 13 14 15 16 17 18 19 20 21 22 23 24 25 26 27 |
library(quantmod) end- format(Sys.Date(),"%Y-%m-%d") start-format(as.Date("2003-09-18"),"%Y-%m-%d") dat0 = as.matrix(getSymbols("AAPL", src="yahoo", from=start, to=end, auto.assign = FALSE)) dat1 = as.matrix(getSymbols("spy", src="yahoo", from=start, to=end, auto.assign = FALSE)) n = NROW(dat0) ret = (dat0[2:n,6]/dat0[1:(n-1),6] - 1) ret_spy = (dat1[2:n,6]/dat1[1:(n-1),6] - 1) ## Resistant Regression function: mltsreg = modified least trimmed regression mltsreg = function(x = ret, y =ret_spy, k){ trimmedx = x[x<quantile(x,k) & xquantile(x,1 - k) ] trimmedy = y[x<quantile(x,k) & xquantile(x,1 - k)] MtrimmedReg = lm(trimmedx~trimmedy) MtrimmedReg } ## plot: plot(ret~ret_spy, main = "AAPL Over SPY - Resistant Regression, Fitted Values", xlab = "Market Returns",ylab = " Returns") s = seq(.8,.95,0.05) ; for.legend = NULL col1 = c(1:length(s)) for(i in 1:length(s)){ abline(mltsreg(k = s[i])$coef[1:2], col = col1[i], lwd = 1.5) for.legend[i] = c(paste(signif(1 - s[i], 2),"Percent Trimmed, ", "Beta =" ,paste(signif(mltsreg(k = s[i])$coef[2],2) ))) } abline(lm(ret~ret_spy)$coef[1:2], col = 'gold', lwd = 3) legend("bottomright",c(for.legend,'OLS, Beta = 0.97'), bty = "n", col = c(col1,'gold'), lty = c(1), lwd = c(rep(1.5,5,),3)) |


There’s a minor error in the code.
Change lines 2 and 3 to the following:
end= format(Sys.Date(),”%Y-%m-%d”)
start=format(as.Date(“2003-09-18″),”%Y-%m-%d”)
Thanks for all the awesome work, just stumbled upon your blog today and it is by far my favourite!
Always nice to hear.