Having stock market in mind, in the previous post: “Price is right, part one.”, I stated that we should not think in terms of “the price went up/down too much” but that “the current price level is wrong since…. and the market is not getting it because…”, bearing in mind that Mr. Market is not a weak player to say the least.
In this post I back this claim with the examination of a trading strategy that ignores economical arguments, thus is only based on relative price moves. Say you believe my previous post is horseshit, wouldn’t it be nice to short the market if it’s “too high” and to long it when it “went down too much”? Fine!, let’s have a look at the performance of such a strategy.
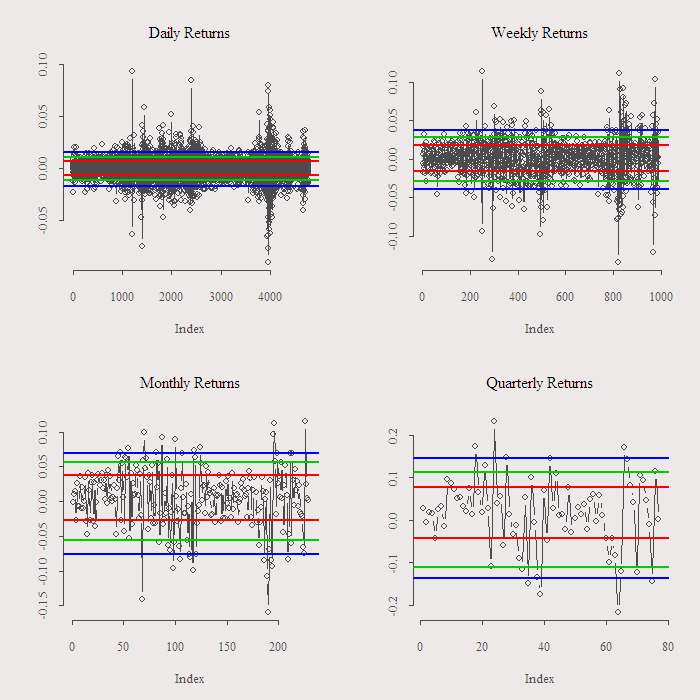
We are going to check what can we gain by buying (shorting) the index if it went down (up) “too much”. We need to decide what is “too much”. What I did is to look at the distribution of the returns and decided that “too much” is a move that is above certain quantile. For example, went up too much means that the move was such that it belongs to the top 5% moves. Put differently, I only short the market if it went up in such a sharp way that it does that only 5% of the days. We are going to check it for 5%, 10% and 20%. Apart from that, one can think: “oh, it might not work on a daily frequency since there is not enough time for the market to reverse its mistake..”. We alleviate this concern by checking daily, weekly, monthly and quarterly frequencies. The next figure illustrate exactly what I do:

We short the market when the observation is above (say) the upper blue line and go long if the observation is below the blue line. We close the position after one period. I claim that this will not do much for us as a general rule. Point being that even when you know the move is “too much” there is no reason to expect a reversal, and so it should not matter if we observe a sharp move, we should not act on that, in that regards, no such thing as “too much”.
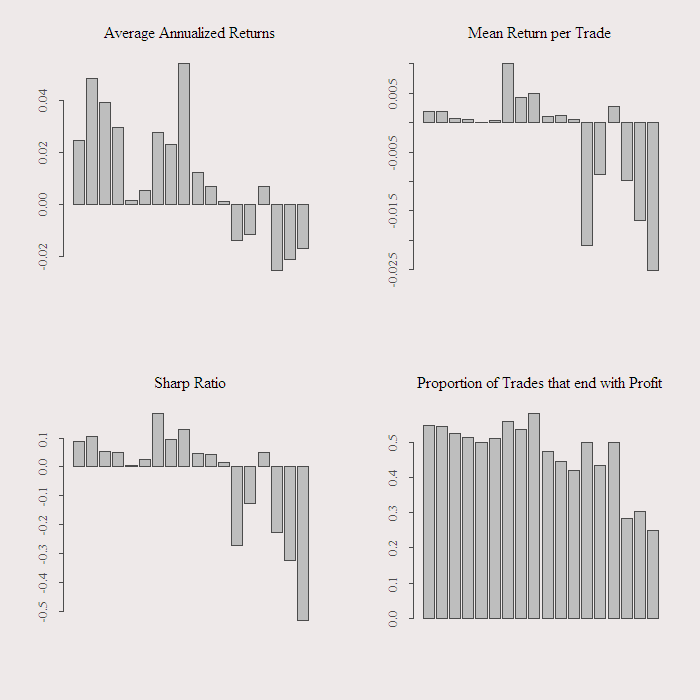
For the quarterly there are not enough trades so I drop it. The next figure shows the results of this simple trading strategy, average annualized return, average return per trade, sharp ratio and proportion of success. Trading costs are excluded from the analysis as well as the slippage, so in practice results are even worse.

We see that results are poor for all frequencies and for all 3 different quantiles. I separated the long short strategies to see that shorting when the move is above 95% is as bad as going long when the move is below the 5%. The annual return is worse then what we can get almost risk free, at most around 5% which we can achieve with a long term triple A bond. The sharp ratio is low to negative and proportion of success is as worse as flipping a coin.
I hope this will be useful for those of you who consider buying a stock that went down “too much”, even if the stock represents long standing institutions like lehman-brothers or ING. On the contrary, in these kind of stocks Mr. market is highly involved and there is even less chance that a sharp move is a mistake, as unimaginable as this might seem few moments before. As always code (nice one this time..) and references are below, thanks for reading.
References:
http://www.amazon.com/Invisible-Hands-Traders-Bubbles-Crashes/dp/047060753X
|
1 2 3 4 5 6 7 8 9 10 11 12 13 14 15 16 17 18 19 20 21 22 23 24 25 26 27 28 29 30 31 32 33 34 35 36 37 38 39 40 41 42 43 44 45 46 47 48 49 50 51 52 53 |
library(quantmod) ; library(PerformanceAnalytics) ; library(xts) tckr<-c("SPY") start <- "1993-01-01" end <- format(Sys.Date(),"%Y-%m-%d") dat0 = (getSymbols(tckr, src="yahoo", from=start, to=end, auto.assign = FALSE)) dat1 = to.weekly(dat0) dat2 = to.monthly(dat0) dat3 = to.quarterly(dat0) retd = (as.vector(dat0[1:NROW(dat0),4]) - as.vector(dat0[1:(NROW(dat0)),1]) )/ as.vector(dat0[1:(NROW(dat0)),1]) retw = (as.vector(dat1[1:NROW(dat1),4]) - as.vector(dat1[1:(NROW(dat1)),1]) )/ as.vector(dat1[1:(NROW(dat1)),1]) retm = (as.vector(dat2[1:NROW(dat2),4]) - as.vector(dat2[1:(NROW(dat2)),1]) )/ as.vector(dat2[1:(NROW(dat2)),1]) retq = (as.vector(dat3[1:NROW(dat3),4]) - as.vector(dat3[1:(NROW(dat3)),1]) )/ as.vector(dat3[1:(NROW(dat3)),1]) ret = list(retd,retw,retm,retq) quan = matrix(nrow = 4, ncol = 6) Ret.One.Period.After = list() Startegy.Ret= list() for (i in 1:4){ quan[i,] = quantile(unlist(ret[i]), c(.05,.1,.2,.8,.9,.95)) for (j in 1:3){ ind1 = match( ifelse(unlist(ret[i]) < quan[i,j],1,0) ,1 ) ind2 = match( ifelse(unlist(ret[i]) > quan[i,(j+3)],1,0) ,1 ) a1 = NULL ; a2 = NULL for (k in 1:(length(ind1)-1)){ a1[k] = ifelse(ind1[k] == 1, unlist(ret[i])[(k+1)], NA ) } for (k in 1:(length(ind2)-1)){ a2[k] = ifelse(ind2[k] == 1, unlist(ret[i])[(k+1)], NA ) } Ret.One.Period.After[[j]] <- na.omit(a1) Ret.One.Period.After[[(j+3)]] <- -na.omit(a2) # You are shorting in this case hence the minus } Startegy.Ret[[i]] = Ret.One.Period.After } perf = function(returns){ x = na.omit(returns) a = data.frame(Sum.of.returns = sum(x), Mean.of.returns = mean(x), SharpRatio.of.returns = mean(x)/sd(x), Number.of.trades = length(x), Hit.ratio = sum(ifelse(x>0,1,0)/length(x) )) } a = NULL for (i in 1:4){ for (j in 1:6){ b = perf(Startegy.Ret[[i]][[j]]) a = rbind(a,b) }} g = 18 barplot(a[1:g,1]/18,main = 'Average Annualized Returns') barplot(a[1:g,2], main = 'Mean Return per Trade') barplot(a[1:g,3], main = 'Sharp Ratio') barplot(a[1:g,5], main = 'Proportion of Trades that end with Profit') |


