Every once in a while I play poker online. The poker site allows you to ask for tournament history. You get an email which contains hundreds summaries (I open several tables at once so have quite some history), a typical summary looks as follows:
|
1 2 3 4 5 6 7 8 9 10 11 12 13 14 15 16 17 |
Buy-In: $6.92/$2.30/$0.78 USD 9 players Total Prize Pool: $62.28 USD Tournament started 2016/04/18 14:53:00 ET Tournament finished 2016/04/18 15:29:33 ET 1: eskobar64 (Poland), $31.15 (50.016%) 2: Arshik07 (Russia), $18.68 (29.993%) 3: gravost (Germany), $12.45 (19.99%) 4: fmlx (United Kingdom), 5: Winterest (Russia), 6: kalmafilter (Netherlands), 7: Sid1901 (Russia), 8: Aleo656 (Germany), 9: artem2670 (Russia), You finished in 6th place. |
I could not help thinking that with this unique dataset we can apply statistics to answer the question: “Is there any one country which produces better players?”. If positive, I can condition myself to be more careful when facing a player from that country (you can see where the player is from when hovering over the avatar).
So, after some gsub , gregexpr and some regmatches I managed to clean this ugly data and extract the ranking for each tournament according to countries (data at the end of the post).
First, let’s have a look which countries send the most players. United States is excluded, they have their own site.
Where players are coming from?

Russia dominates with almost 20% of the players. The top four countries constitute almost half of the total number of players, makes sense given their size.
Let’s have a look who is winning, adjusting for size of a country by looking at percentages. What is plotted is the number of times the country took first place as a fraction of the number of games the country played.
Which countries win the sit-and-go tables?
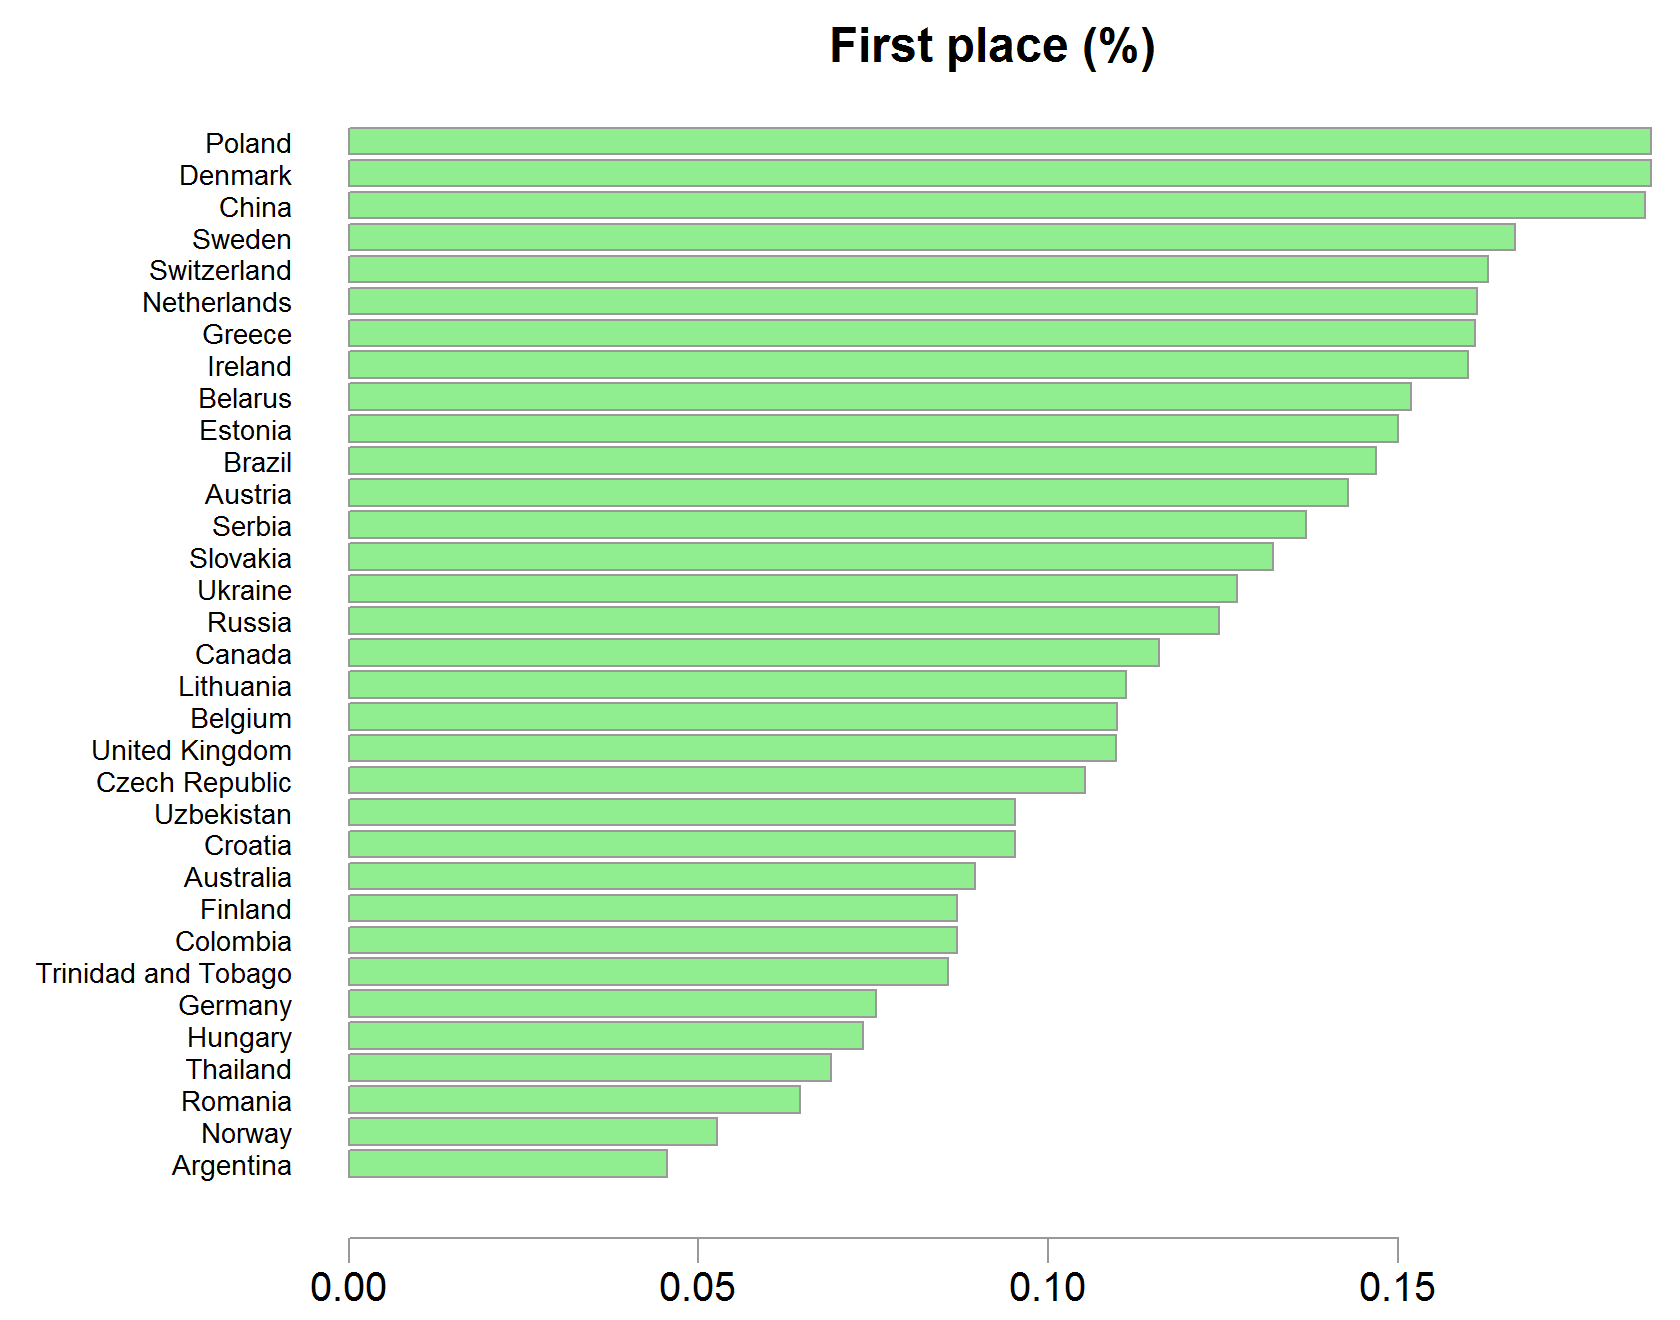
Polish players in the top, followed by Denmark. I don’t have any memory of an exceptional Polish player, but I definitely remember Eastgate of Denmark, a 22 years old who surpassed a field of 6843 players in the WSOP main event of 2008.
Does this now mean that I should be more careful when facing Polish or Danish players?
Of course not.
Those countries constitutes only about 3% of the overall field of players in the sample, extreme results are much more likely. And even if that has not been the case, in a sit-and-go of 9 equally talented monkeys the first-place proportion should be 1/9 ~ 11% anyway. We see a proportion of about 18%, but is 18% really that “far” from 11% in this case?
Test equality of proportions using bootstrap
When I grew up I was taught to use “The test statistic for testing the difference in two population proportions”. That is, for testing the null hypothesis  versus
  , we can compute the test-statistic using a formula and that quantity is normally-distribution (asymptotically at least). So we can place the resulting test-statistic in the normal-table and see how abnormal the result is. If it is very abnormal we decide “yeah, too abnormal result for the proportion to be the same, so they are not”.
This kind of practice is now dubbed classical statistics. Those tests were very often designed by fantastic minds, partly to minimize the hard labor of mechanical computation. They are backed by mature, assumptions-littered, optimal theory. I believe most first-course-in-statistics curriculums did not change yet.
Those classical test-statistics are not my go-to anymore, nor they should be yours.
Sure, the bootstrap is a computational spendthrift and require some coding. But generality of applicability, and of course current computational powers have transported the bootstrap to dominate modern statistical practice. See here for the ASA statement on p-values, and here for some references on the importance of Bootstrap in statistics.
|
1 2 3 4 5 6 7 8 9 10 11 12 13 14 15 16 17 18 19 20 21 22 23 |
RR <- 100 # number of boostraps TT <- NROW(Table) pp <- NCOL(Table) boottab <- array( dim= c(TT, pp, RR) )# bootstrap table for (i in 1:RR){ tmpind <- sample(1:NROW(Table), NROW(Table), replace= T) boottab[1:TT, 1:pp, i] <- as.matrix(tab1[tmpind,]) } ranking_boot <- list() # This would contain the ranking for each countries for (j in 1:RR) { ranking_boot[[j]] <- list() # bootstrap copy for (i in CountryName) { ranking_boot[[j]][[i]] <- boottab[boottab[,2,j]==i,1,j] # each j is one copy } } # Now we can ask to see the proportion of Poland across the bootsrap samples percent_1_boot <- NULL countryy <- "Poland" for (j in 1:RR){ percent_1_boot[j] <- sum(ranking_boot[[j]][[countryy]]==1)/length(ranking_boot[[j]][[countryy]]) } |
Plotting the distribution of the proportion of first-place by Polish players. The light brown dashed lines are the proportion we compare against. There are two brown lines since I play both 9 and 6 players handed sit-and-go.
Polish players are not exceptionally better
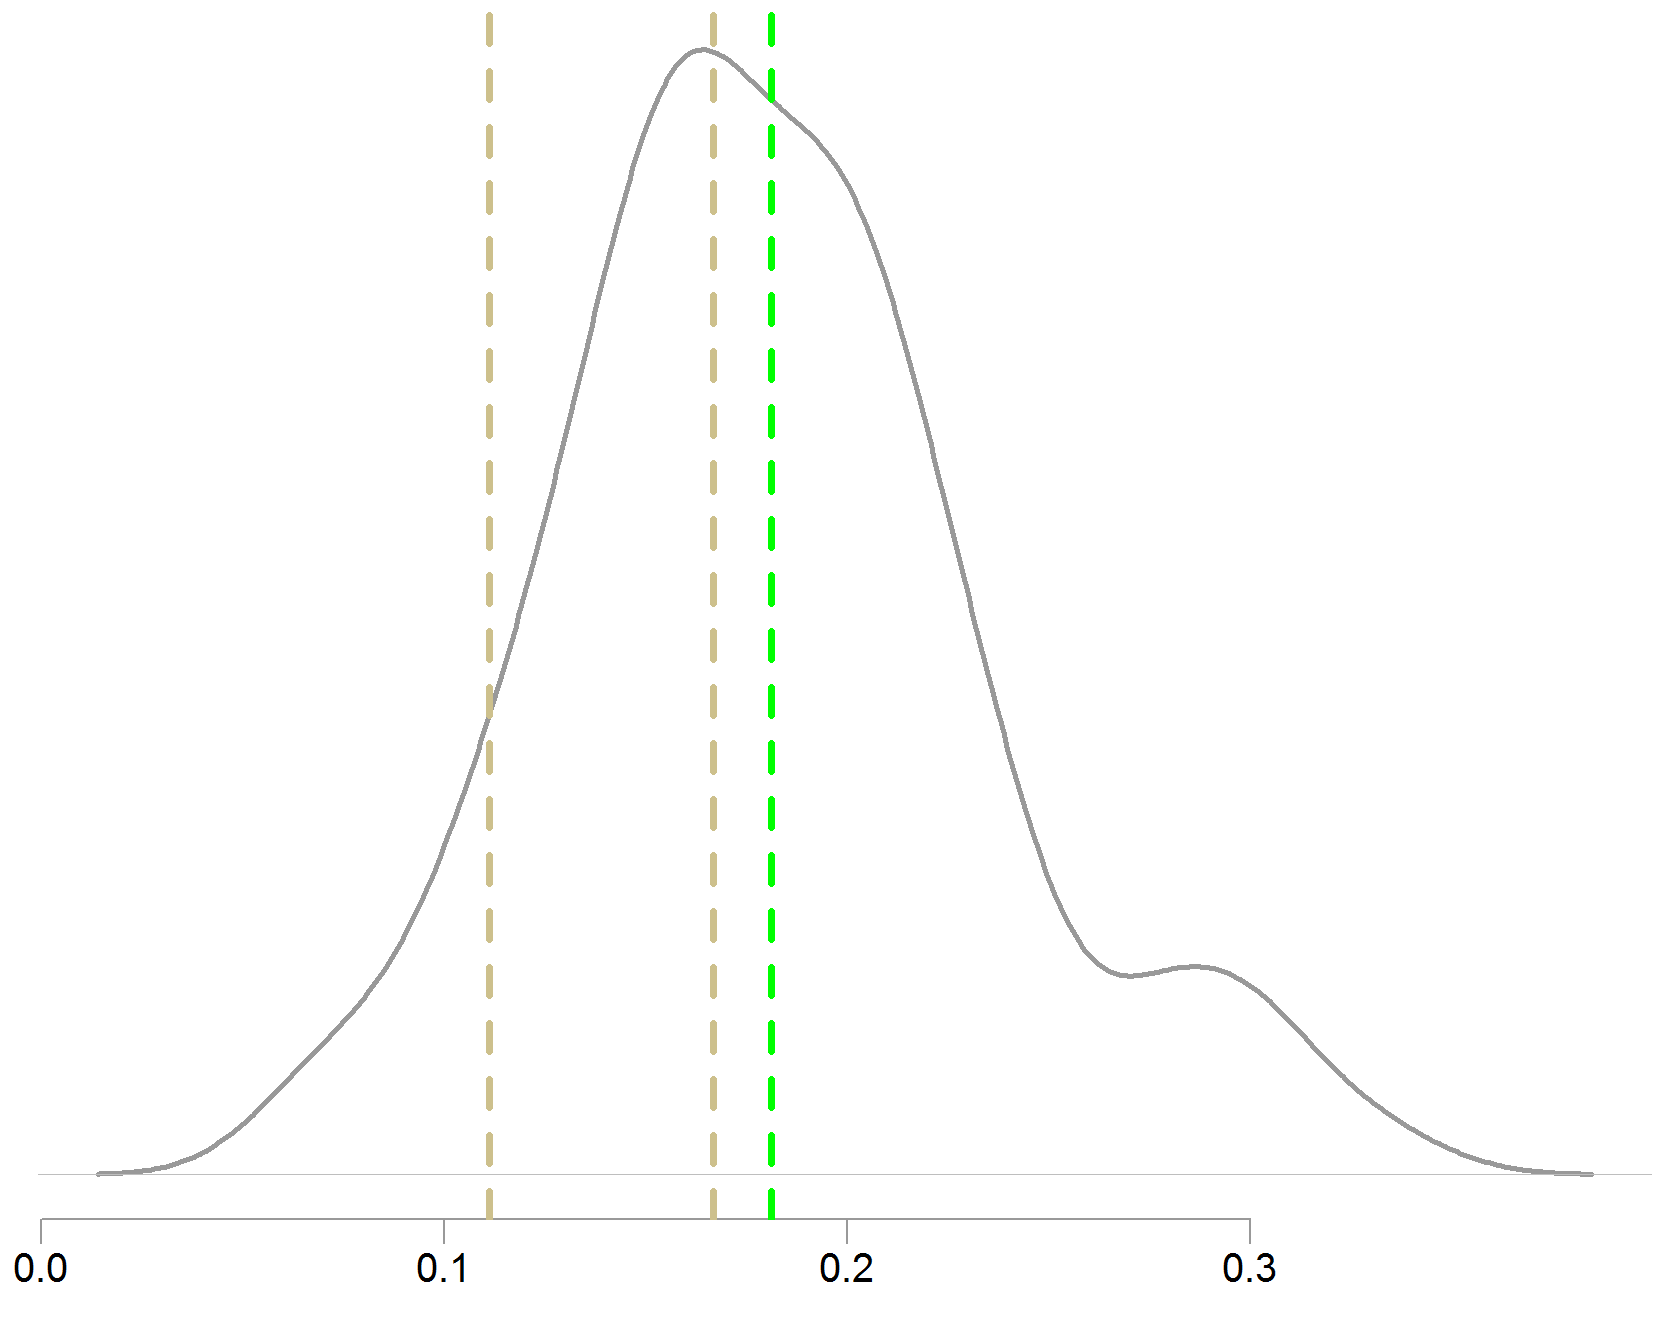
If we need to make a dichotomous decision then I don’t think there is any difference in proportions. But this figure is already good information, I will add this to my consideration-set when thinking if calling or folding against an opponent from Poland or Denmark.
Results are of course subject to the very limited niche, only sit-and-go tables ranging from 7-15$ buy-ins. We can also do the same to see if come countries send particularly weak players (Argentina has no first place winners).
The data can be downloaded from here. It is already clean. You will load a list of countries and their ranking when participated. Something like that:
|
1 2 3 4 5 6 7 8 9 |
... $Thailand [1] 3 5 3 3 5 2 1 5 7 4 3 4 2 3 5 3 3 5 2 1 5 6 4 6 3 4 8 6 4 $`Switzerland` [1] 6 4 9 2 8 8 6 2 4 2 2 6 3 3 6 2 3 1 6 4 9 2 8 8 6 7 1 8 4 4 8 1 4 2 5 ... |
Some further readings
By far the best book I have read about poker. The red sequel is also excellent.
Harrington on Hold ’em (amazon link)


