You probably know that even a trading strategy which is actually no different from a random walk (RW henceforth) can perform very well. Perhaps you chalk it up to short-run volatility. But in fact there is a deeper reason for this to happen, in force. If you insist on using and continuously testing a RW strategy, you will find, at some point with certainty, that it has significant outperformance.
This post explains why is that.
The explanation dates back to Kolmogorov and Khinchin (1920’s), who phrased the law of the iterated logarithm, which tells us that:
(1)
where is a sum of independent random variable with zero mean and unit variance.
So if a strategy is simply a RW, does not provide any excess returns, it has mean of zero, and when we compute the t.stat, we scale it so that it has unit variance. Noting that and manipulating the above expression towards the familiar t.stat:
by multiplying both sides with
we have
(2)
which leaves us with as the pace of growth (see the
inside there).
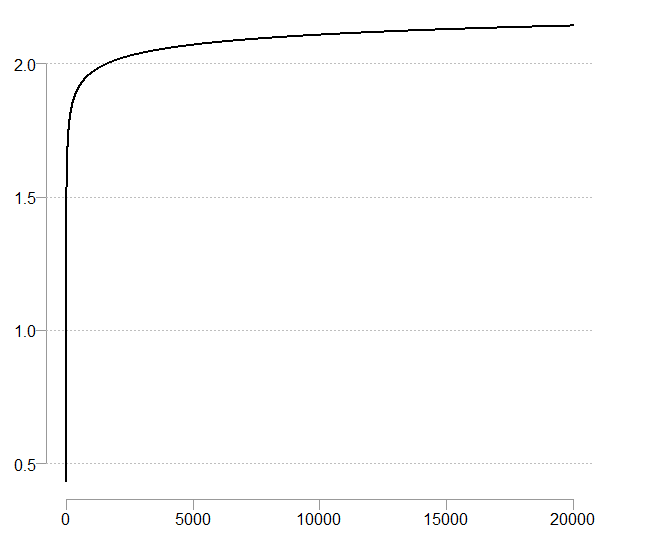
A very slow pace of growth indeed. I guess this is a reason this issue is not discussed more often. You have to be quite unlucky to snapshot the strategy exactly where it is significant. Nonetheless, from this you can see it will become significant with probability 1. If the strategy is weekly or monthly, you are quite safe. But if you are a high-frequency trader, checking the performance on a daily basis, trading every minute (so 390 trades per day). This is still relevant for you.
In theory, you must conclude at some point that you have found the holy grail (of course, maybe you did find it I am not saying).
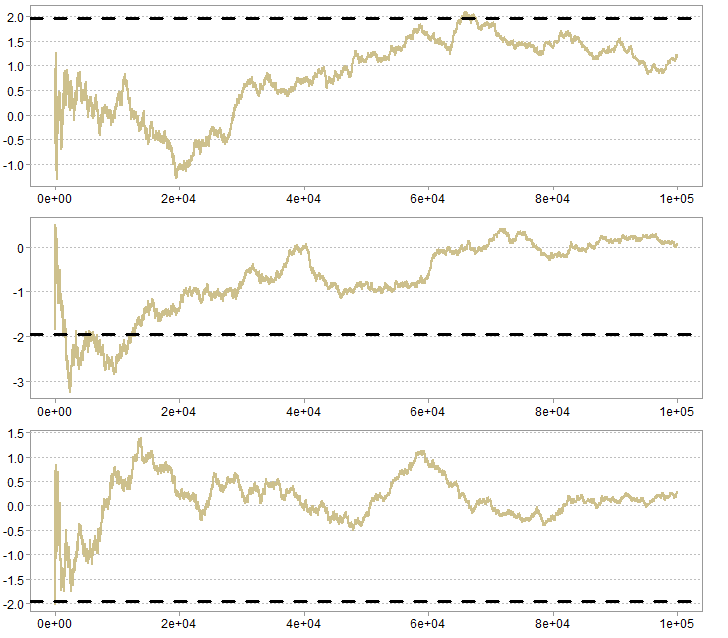
As an illustration, you can generate some sequence and plot. You can also experience how slow really is:

Code:
|
1 2 3 4 5 6 7 8 9 10 11 |
NN <- 10000 x <- rnorm(NN, mean= 0, sd= 1) seq_sum <- NULL for(i in 1:NN){ seq_sum[i] <- sqrt(i)*(sum(x[1:i])/i) } plot(seq_sum) abline(h= 1.96, lty= "dashed", lwd= 2) abline(h= -1.96, lty= "dashed", lwd= 2) |
Few sequences.

You can see the sharp fluctuations around the starting points, which are akin to the acceleration see in the first figure. Later, with a very moderate growth with each additional observation, it takes some time to break through the critical boundaries, though the math tells us this is unavoidable.
For more, see this excellent book, chapter 7 in particular.
In All Likelihood


One comment on “Why bad trading strategies may perform well? Mathematical explanation”