Where I work we are now hiring. We took few time-consuming actions to make sure we have a large pool of candidates to choose from. But what is the value in having a large pool of candidates? Intuitively, the more candidates you have the better the chance that you will end up with a strong prospective candidate in terms of experience, talent and skill set (call this one candidate “the maximum”). But what are we talking about? is this meaningful? If there is a big difference between 10 candidates versus 1500 candidates, but very little difference between 10 candidates versus 80 candidates it means that our publicity and screening efforts are not very fruitful\efficient. Perhaps it would be better running quickly over a small pool, few dozens candidates, and choose the best fit. Below I try to cast this question in terms of the distribution of the sample maximum (think: how much better is the best candidate as the number of candidates grow).
Generally speaking, the distribution of the maximum, or any other order statistics is non-trivial and hard to estimate. Probabilistically speaking, if we denote the ith candidate as  and the maximum of all n candidates with the letter Y then we are after
  :
:
(1) 
(2) 
In words, for the probability that the best candidate is worse than some value  all other candidates should be also worse than that , and if the candidates are independent (a reasonable assumption) then we simply multiply the probabilities. Ok, lets do some simulations.
The following function takes a number of candidates TT as a parameter and the distribution of how talented each candidate is, dist, defaulting to Normal distribution, and returns the maximum. We can do that say 2000 times and have a look at the distributions as a function of the number of candidates and the individual talent distribution.
repet <-  2000
draw_max <- function(TT, dist= rnorm, ...) { dist(TT, ...) %>% max }
Now lets look at how the distribution looks like for say TT= c(10, 100, 1000, 10000)
xmax <- rep(10, repet) %>% lapply(draw_max) %>% unlist
density(xmax) %>% plot(col= "darkgreen", lwd= 2, xlim= c(0,5.5),
ylim= c(0, 1.5), ylab="", main="")
TT_seq= c(10^2, 10^3, 10^4)
for (i in TT_seq){
xmax <- rep(i, repet) %>% lapply(draw_max) %>% unlist
density(xmax) %>% lines(col= "darkgreen", lwd= 2)
}
Distribution of the maximum of TT= c(10, 100, 1000, 10000) draw from a normal distribution
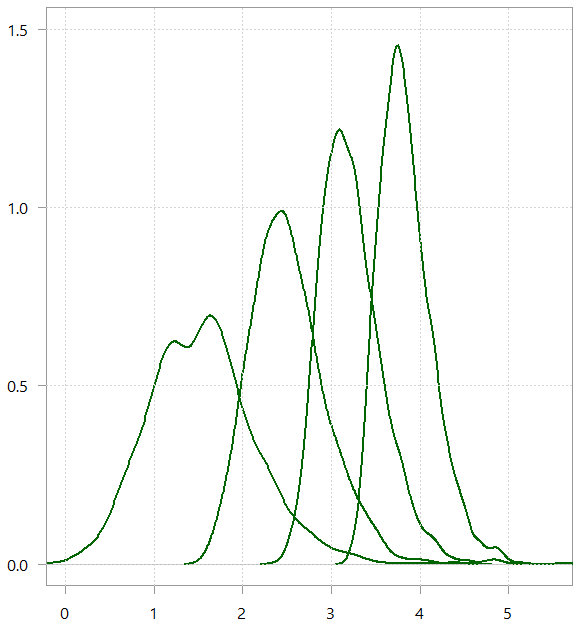
As the number of observations (candidates in our example) increases we are likely to end up with a much better candidate. But, it is highly non-linear in the sense that to progress say from 3 to 4, we need 9000 candidates more. Unrealistic.
A more realistic scenario is to increase the number of candidates say from 20 to 60 or similar order of magnitude. This is roughly how the distribution of the maximum looks like in that case:
Distribution of the maximum of TT= c(10, 20, 40, 60) draw from a normal distribution
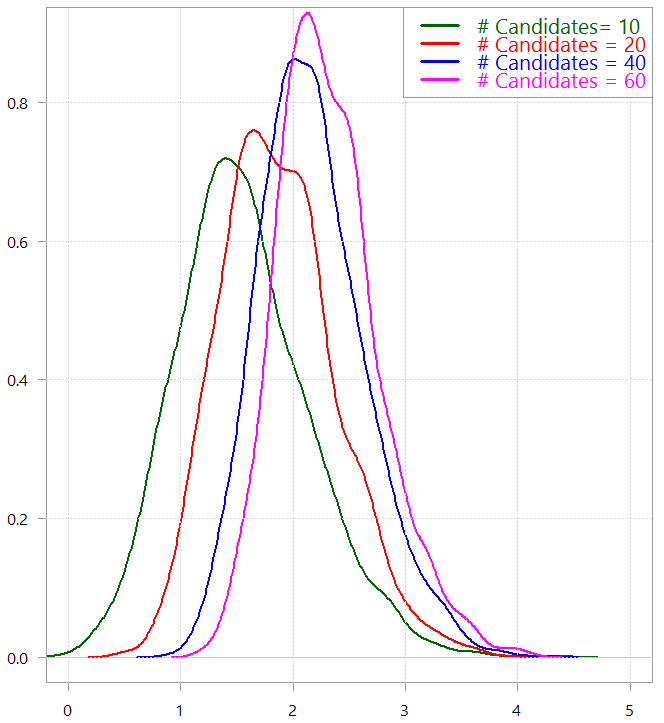
Hmm, not very appealing. Increasing the number of candidates from 40 to 60 does not mean much higher chance to onboard someone considerably better.
However, the position is for a Data Scientist. This is fairly a new field with high demand; and supply follows. That is to say a lot, really a lot, of people dubbing themselves as data scientists \statisticians, while in effect they are deficient in all matters statistics (I think a rising term describing this phenomena is “citizen data scientist”). On the other end of the spectrum you have those truly passionate, practicing modern statistics for years now, as a hobby, for free on their own ticket, or as part of a day job. Point is that the talent distribution in the data science field is not normal, but much more dispersed in my personal opinion. Now lets assume that indeed the talent factor is a t-distribution and look again at the distribution of the maximum as a function of the number of candidates:
Distribution of the maximum of TT= c(10, 20, 40, 60) draw from a t(3)-distribution
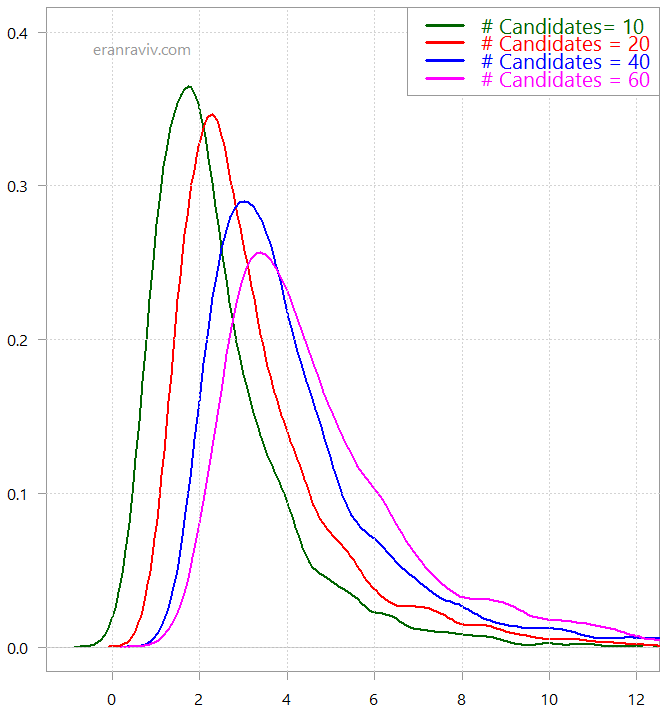
Now it looks that our actions do make sense. Increase the number of candidates from 20 to 60 may, percentage wise, almost double the chance to onboard a much better quality candidate (assuming you can fish out the maximum). Not only that, the fat right tail means that we are far more likely to spot a truly exceptional candidate.
As a final side note, this post also serves as an example for how one can pick up on realistic day-to-day philosophical-look-alike questions, and give a quantified educated reply with fairly minimal and not unrealistic assumptions.
References
Statistical Analysis of Extreme Values


