I like using  for many reasons. Two of those are (1) easy integration with almost whichever software you can think of, and (2) for its graphical powers. Color-wise, I dare to assume you probably plotted, re-specified your colors, plotted again, and iterated until you found what works for your specific chart. Here you can find modern visualization so you are able to quickly find the colors you look for, and to quickly see how it looks on screen. See below for quick demo.
Motivation
Here you can find a list of colors in R. This pdf file is one of the first links you get when searching online. Drawbacks, in my opinion:
Less is more: those names would work well in R, but are not defined when you integrate R with html or JavaScript (think plotly chart). For example, there is a burlywood color, but no burlywood2.
The pdf shows how colors are on a pdf, rather than on screen. For example, on screen you will be hard-pressed to distinguish between the colors honeydew and whitesmoke while on pdf it may be easier.
It is hard to compare colors which are very similar, but located far apart on the pdf. Your eyes need to “fill the void” so to speak.
Perhaps a more dynamic approach..
The supposed improvements
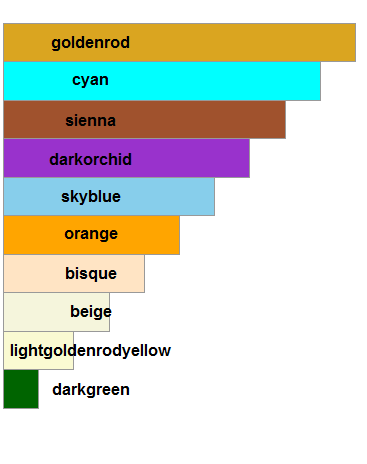
Colors are sorted based on their shade value (how dark the color is). So you can distinguish quickly between similar colors.
Dynamic, zoom in to compare similar colors.
Already on screen, so you know how it would look on screen.
Cross software colors. Rather than having hundreds of colors to choose from, it is narrowed down to “just” 129. But the names are consistent with CSS\HTML.
I think 129 colors are enough for most. If you need more, this link is useful.
Happy coloring.
The actual color-names widget is here.
Enjoy .
.