I have recently been reading about more modern ways to decompose a matrix. Singular value decomposition is a popular way, but there are more. I went down the rabbit whole. After a couple of “see references therein” I found something which looks to justify spending time on this. An excellent paper titled “CUR matrix decomposition for improved data analysis”. This post describes how to single-out the most important variables from the data in an unsupervised manner. Unsupervised here means without a target variable in mind.
Contents
CUR matrix decomposition
CUR matrix decomposition provides an alternative to the more common ways like SVD or PCA. Why do you need an alternative? Because PCA (for example) provides you with some latent factors. But those factors are not very informative or meaningful in any clear inductive way. If you want the story behind PCA, you need to sprout it from within, typically by looking at the factor’s loadings and inventing a way to interpret those. Beyond the first factor it can be quite challenging and karma-dependent.
The paper I reference here proposes an algorithm to get an interpretable lower rank approximation. Their proposal is based on capturing the “influence” of a given variable/column, which is what attracted my attention: A way to measure the importance (for a lack of a better word) of a particular variable; particular column in your data matrix, in an unsupervised manner.
Their equation (3) in the paper (link below) reads
![\[\pi_j = \frac{1}{k} \sum_{\zeta=1}^k (v_j^{\zeta})^2,\]](https://eranraviv.com/wp-content/ql-cache/quicklatex.com-d173e19525de6d17cc662780e5de65fa_l3.svg "Rendered by QuickLaTeX.com")
where  is the normalized statistical leverage score for particular column and the
  are simply the right singular vectors from an SVD of the original data matrix.
What is the meaning of a leverage scores?
Good question. The oil price is one of variable in the matrix which drives the consumer price index. Economically speaking, that variable (column) is very important for understanding of the consumer price index data (matrix). Wouldn’t it be nice if we would have some statistical procedure to recognize those important columns? PCA constructs linear combinations which explains the variability in the data, but those are hard to interpret. Just tell me which variables are important, not which linear combination is important. To be able to point out the variables which are “important” without any target is quite an enticing proposition, I think.
Let’s examine the highest market capital 94 blue chip stocks and see if we can tell which individual names are the most relevant for the over all movement in the data, using this statistical leverage scores method. Here are the results (code below). It turns out these are the most important names in the sense that they drive the most of the movement in the data:
[1] "BBY" "QCOM" "OKE" "KR" "WBA"
What makes for a special variable?
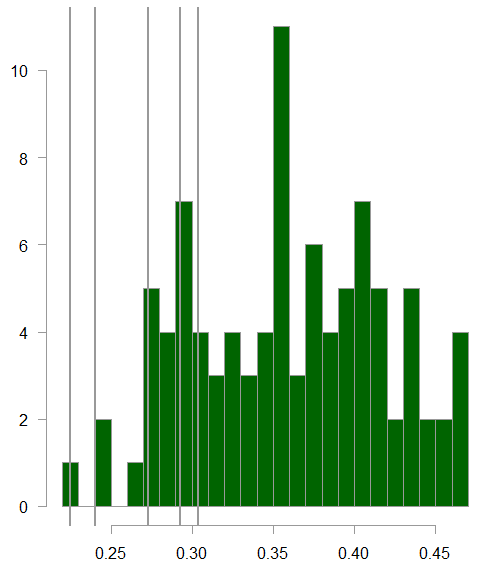
Of course, an itching question is what so special about those names that they were chosen? Is it because they have the largest standard deviation (SD from here on)? so that they exert a large pull on the overall matrix? Let’s check:
Distribution of the standard deviation of all the stocks in the data

The 5 grey vertical bars are those 5 names. We see that their SD indeed lay above the average, but we also see that there are other names with higher SD that are not flagged as particularly important based on their statistical leverage score.
What about the cross correlation? Each name has a correlation with all the rest. The figure below shows, on average, how much each name is correlated with all the rest:
The 5 grey vertical bars are those 5 names. We see that on average they have less correlation with the rest of the names.
So for a name to be flagged as important in the data it should have high SD while keeping it’s own “independence” in as much as possible. If a name has high variance, but is also highly correlated with the rest, then it is not particularly important, while if a name is quite independent, but not very influential for the overall movement in the data (low SD) then it is also not worthy of special attention.
In sum
The statistical method outlined in this post shows how to check the “influence” or “importance” of particular variable in the context of a matrix data. Turns out that influential, intuitively means, one that has fairly high variability, yet is quite independent from the rest- and hence deserves more attention. Use this numerical procedure to examine which individual variables, rather than their linear combination as done with PCA, is important for the overall movement in the data. The main, perhaps only, advantage is in term of explainability. It is much easier to communicate which variables are important than communicate which linear combination of the variable is important.
Code
Here is the R code to create the scores. Takes as input the v, from an svd and k, the rank restriction.
levscores <- function(v,k) {
	if (k==1) {
		v[,1]^2
	} else {
		apply(v[,1:k]^2,1,sum)/k
	}
}
Here is the R code for pulling the data and for the histograms
library(quantmod)
tmpfile <- "~/posts/2019-09-Blue Chip highest market cap.csv"
nam <- read.csv(tmpfile, header= F)[,1] %>% as.character
k <- 10 # how many years back?
end<- format(Sys.Date(),"%Y-%m-%d")
start<-format(Sys.Date() - (k*365),"%Y-%m-%d")
l <- length(nam)
w0 <- w1 <- NULL
for (i in 1:l) {
dat0 <- tryCatch(getSymbols(nam[i],
src = "yahoo", from = start, to = end, auto.assign = F,
warnings = FALSE, symbol.lookup = F
),
error = function(e) {
dat0 <- NULL
message(paste("Ticker number", i, ",", nam[i], "was not downloaded"))
}  )
tryCatch(w1 <- weeklyReturn(dat0), error = function(e) {
return(NULL)
})
w0 <- cbind(w0, w1)
}

svd0 <- svd(w0) # perform svd
lev_scores <- levscores(svd0$v, k= 20)
tmp_ind <- lev_scores %>% order(decreasing= T) # temp index
# check what are the top 5 most important
topp <- 5
nam[tmp_ind] %>% head(topp)
[1] "BBY"  "QCOM" "OKE"  "KR"   "WBA"

# Histograms
apply(w0,2,sd) %>%  hist(breaks=22, col= "darkgreen", ylab="", main="")
abline(v= apply(w0,2,sd)[tmp_ind] %>% head(topp) , lwd= 2)

cor_mat <- cor(w0, use= "pairwise.complete.obs")
apply(cor_mat,1,mean) %>% hist(breaks=22, col= "darkgreen", ylab="", main="")
abline(v= apply(cor_mat,1,mean)[tmp_ind] %>% head(topp) , lwd= 2)
References
CUR matrix decomposition for improved data analysis
Projection Matrices, Generalized Inverse Matrices, and Singular Value Decomposition


Upon request here you can find the csv file with the Blue Chip highest market cap list.