Recently, we hear a lot about a housing bubble forming in UK. Would be great if we would have a formal test for identifying a bubble evolving in real time, I am not familiar with any such test. However, we can still do something in order to help us gauge if what we are seeing is indeed a bubbly process, which is bound to end badly.
We will use the ADF test (Augmented Dicky Fuller) for this, so I start with a simple explanation about this test and move on to the implementation. The way this test works is as follows:
![\[\Delta x_t = \beta x_{t-1}+e_t.\]](https://eranraviv.com/wp-content/ql-cache/quicklatex.com-376b13d4da88f4550decaae220e1f829_l3.svg "Rendered by QuickLaTeX.com")
What we are doing is to check whether the level of the series ‘x’ has any influence on the future change. This is the core idea of the test. Imagine  is 1.5, this would mean that the higher the level of the series, the more likely it is to climb up, i.e. the difference next period is positive. This is a characteristic of a bubble series, it is self-feeding and price level goes up just because it goes up. In the other hand, if
  it means that the series is mean reverting and not explosive. We can add (augment) a trend term and more lags and call it Augmented-Dicky-Fuller test. Now, in a recent practical research an idea put forward is to conduct a sequence of ADF tests. More specifically, say we have 100 observations, we ADF.test sequentially based on the first 99, then based on the first 98
  then lastly, based on the most recent (say) 20 observations and use the maximum of those
  test-statistics. Essentially recognizing that we are in a bubble if we move up too much too fast. Let us see how it works.
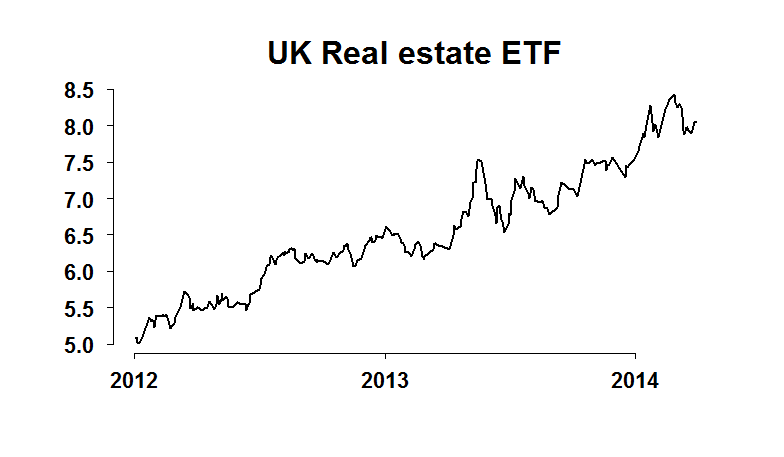
I proxy the UK housing market with an ETF which offers exposure to UK listed real estate companies and Real Estate Investment Trusts. Data easily accessible using Qaundl.
|
1 2 3 4 5 6 7 8 9 10 11 12 13 14 15 |
token <- 'your token' library(Quandl) # required package Quandl.auth(token) # Authenticate ukhousing <- Quandl("GOOG/SWX_IUKP",start_date="2012-01-01",end_date="2014-03-31",sort = c("asc")), collapse='weekly') head(ukhousing,2) Date Open High Low Close Volume 1 2012-01-03 5.10 5.10 5.07 5.07 5850 2 2012-01-05 5.08 5.08 5.08 5.08 10000 hp <- apply(ukhousing[,2:5],1,sum)/4 # ;'average' housing prices (hp) during that week summary(hp) dat <- data.frame(hp=na.omit(hp),Time=ukhousing$Date[!is.na(hp)]) # remove NA and bound plot(dat[,1]~dat[,2],ty="l",main = "UK Real estate ETF",ylab="",xlab="",lwd=2) |
Now let us implement the idea of the sequential ADF.test. R will choose for you how many lags are appropriate and will look for the correct p.values. Don’t rely on the t.test here as the distribution under the NULL is non-trivial.
|
1 2 3 4 5 6 7 8 9 10 11 12 13 |
library(tseries) TT <- NROW(dat) pv <- adfstat <- NULL for (i in round(.2*TT):round(.8*TT)){ temp <- adf.test(dat[i:TT,'hp']) adfstat[i] <- temp$stat pv[i] <- temp$p.value } par(mfrow = c(2,1)) plot(adfstat,ty="l",main="Test-statistics",ylab="",lwd=2,xlab="") barplot(pv,ty="l",main="P.Values",ylab="",xlab="") |
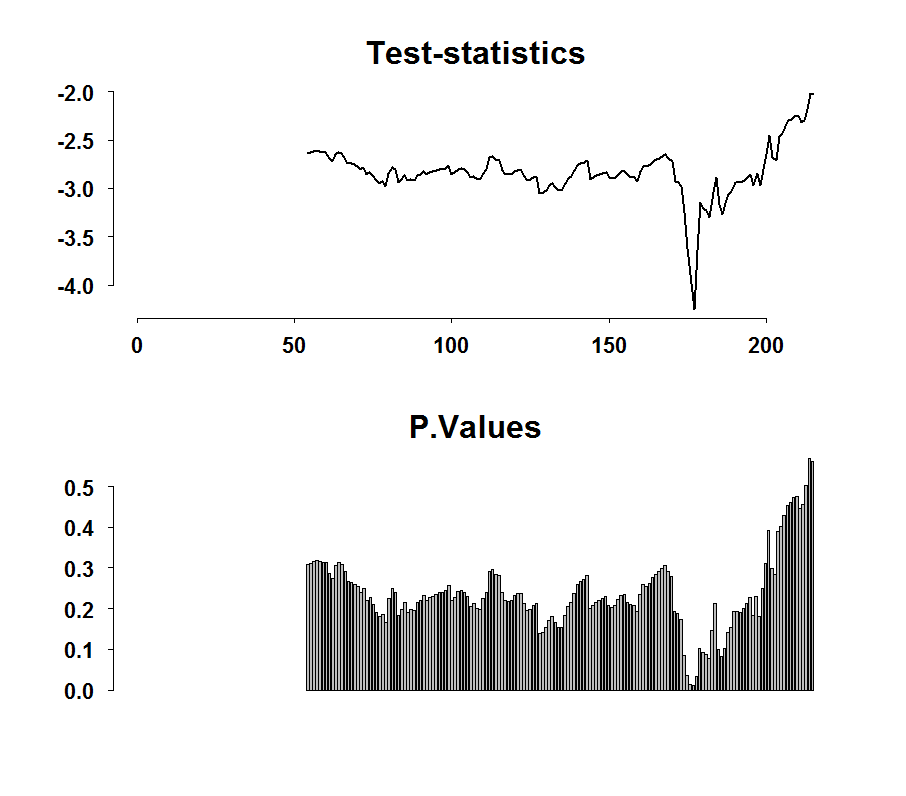
It does look as if we are moving up quite fast. This is suggestive but only exactly that! There is nothing formal here since the distribution of the maximum of the statistics is complicated and so we can’t say whether the maximum at the moment is ‘abnormally’ high. But it can be useful to cross this kind of evidence with other information or to completely dismiss the notion if the maximum is in the far past. We can do the same with other stationarity tests such as the PP.test or the KPSS.test.
Appendix
The paper mentioned in the text:
Some Matlab code to do the same:
|
1 2 3 4 5 6 7 8 9 |
TT = length(dat) adfstat=zeros(TT,1) for i = round(.2*TT):round(.8*(TT)) [adfstat,pValue,stat]= adf(dat(i:TT,1)) adfstat(i)= stat end plot(adfstat) |


Interesting, but have you ever considered D. Sornette’s papers on LPPL to detect bubbles (http://www.slideshare.net/arbuzov1989/seminar-psu-21102013-financial-bubble-diagnostics-based-on-logperiodic-power-law-model) or more generally (http://papers.ssrn.com/sol3/cf_dev/AbsByAuth.cfm?per_id=190544)
An alternate form that may work better for geometric processes, which covers most price series, is to use the log price for x_t, rather than the price itself.
Interesting post, but the problem with a simple ADF is that the explosive behavior is not capture because it is consider as an outlier. Phillips et al (2014) propose a recursive ADF test which over comes this problem; here is the link if you are interested http://ink.library.smu.edu.sg/cgi/viewcontent.cgi?article=2509&context=soe_research. It isn’t very hard to implement in R and it will detect multiple bubbles in the series.