Contents
Orthogonality in mathematics
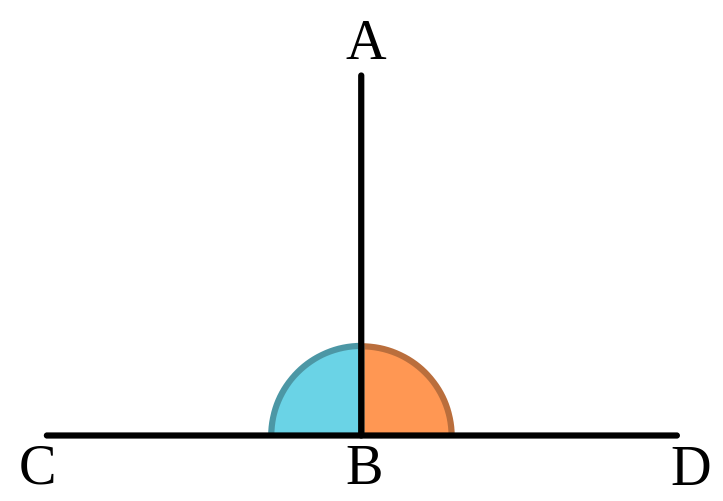
The word Orthogonality originates from a combination of two words in ancient Greek: orthos (upright), and gonia (angle). It has a geometrical meaning. It means two lines create a 90 degrees angle between them. So one line is perpendicular to the other line. Like so:
Even though Orthogonality is a geometrical term, it appears very often in statistics. You probably know that in a statistical context orthogonality means uncorrelated, or linearly independent. But why?
Why use a geometrical term to describe a statistical relation between random variables? By extension, why does the word angle appears in the incredibly common regression method least-angle regression (LARS)? Enough losing sleep over it (as you undoubtedly do), an extensive answer below.
Orthogonality
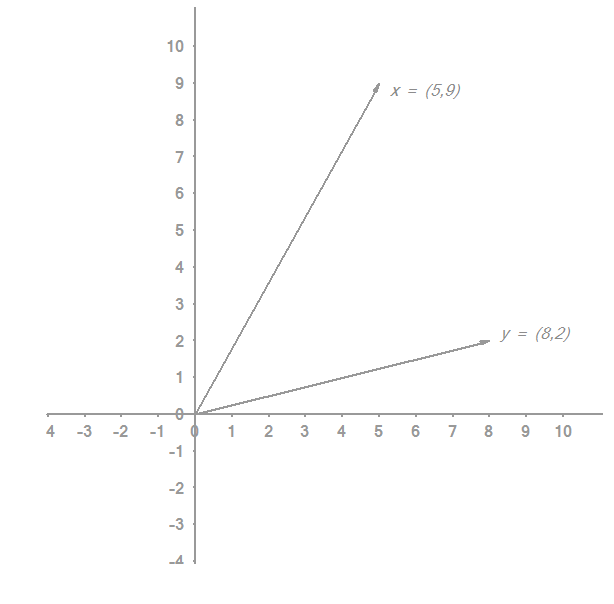
Assume you have those two vectors x and y:
You are searching for the orthogonal projection of  on
on  . Why would you that? For now let’s say you are strange like that. You are looking to “cast” the vector
  such that it sits on top of the vector
  . Because it has to sit on top of the vector , there must be a scalar (call it
  ) which we could multiply the vector with, and get the vector we are looking for. Let’s colorfully appoint the name
  to that vector we are searching for. Another way to look at it: instead of searching for a scalar to multiply with, we can look for couple of numbers to add to
  such that we get the required vector
  . We can call those two numbers
  .
.
There is a simple formula to find that new vector:
![\[\tilde{y} = \{ \frac{ y x }{ x x } \} x.\]](https://eranraviv.com/wp-content/ql-cache/quicklatex.com-0e47599ea4f2d878fb8626bb137944e4_l3.svg "Rendered by QuickLaTeX.com")
Both and variables are vectors, so it is a vector multiplication (not element-wise).
Notice that we also found the scalar :
![\[\tilde{y} = \overbrace{\{ \frac{ y x }{ x x } \}}^{\alpha} x.\]](https://eranraviv.com/wp-content/ql-cache/quicklatex.com-c80b098ac1bf4a9a96704b1ad3bec27f_l3.svg "Rendered by QuickLaTeX.com")
Because and are vectors we use the %*% operator for vector multiplication in the code, as follows:
y_tild <-  y %*% x / (x%*%x)  * x
print(y_tild)
[1] 2.735849 4.924528
And the scalar is
 y %*% x / (x %*% x)
0.5471698
Now that we have our we can back out the vector  :
:
> Z <- y_tild - y
> print(Z)
[1] -5.264151  2.924528 # those are the number to add to the vector y
Those are the numbers which must be added to the vector in order to “cast” it on the vector .
Let’s make sure that the angle between and is 90 degrees as it supposed to be, which would mean that and are indeed orthogonal. Of course and are also orthogonal because the angle between and is zero. We can use the cosine similarity function to check that.
The cosine of an angle  between two vectors and say, is:
![\[\cos(\theta )={\mathbf {x} \cdot \mathbf {y} \over \|\mathbf {x} \|\|\mathbf {y} \|}={\frac {\sum \limits _{i=1}^{n}{x_{i}y_{i}}}{{\sqrt {\sum \limits _{i=1}^{n}{x_{i}^{2}}}}{\sqrt {\sum \limits _{i=1}^{n}{y_{i}^{2}}}}}}.\]](https://eranraviv.com/wp-content/ql-cache/quicklatex.com-02002de48a5abe70bc5da82bdad664af_l3.svg "Rendered by QuickLaTeX.com")
We know that the cosine of an angle which is 0 equals 1, and the cosine of an angle which is 90 degrees equals 0. So we can check our results are indeed correct.
> library(magrittr)
# Calculate the angle between the vector z and the vector y_tilde
> ang_Z_y_tild= (Z%*%y_tild)/ (  Z^2 %>% sum() %>% sqrt() ) *
(y_tild^2 %>% sum() %>% sqrt() ) ; ang_Z_y_tild
     [,1]
[1,]    0
# Calculate the angle between the vector z and the vector x
> ang_Z_x= (Z%*%x)/ ( sqrt(sum(Z^2))  * sqrt(sum(x^2)) ) ; ang_Z_x
             [,1]
[1,] 5.730183e-17
# Calculate the angle between the vector y_tilde and the vector x
> ang_x_y_tild= (x%*%y_tild)/((  x^2 %>% sum() %>% sqrt() ) *
(y_tild^2 %>% sum() %>% sqrt() ) ) ; ang_x_y_tild
     [,1]
[1,]    1
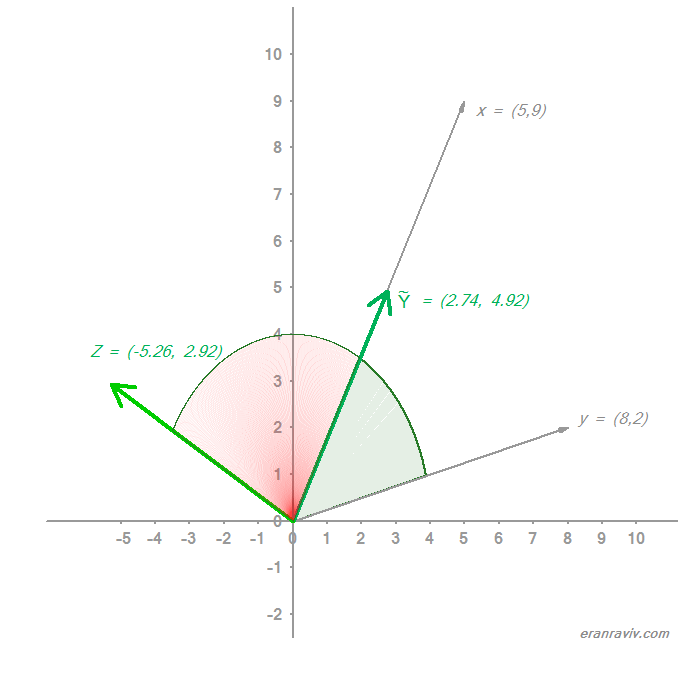
Before we move on to discuss the relation of all this only semi-fascinating geometry with statistics, this is what we have so far:
Finally we can talk business.
Orthogonality and Linear Regression
What is special about being, we now know, (2.74, 4.92)?
Good question. Thanks for asking.
That point (2.74, 4.92), from all those (infinite number of) points sitting on the line between (0,0) and (5,9), is the closest point possible to the point (8,2). Move a bit further on the line towards (5,9) or a bit back towards the origin, and you are moving away from (8,2); Euclidean distance speaking.
In a linear regression context, we try to create a linear combination from our explanatory variables such that they best approximate the target variable . Basically we want to create the closest possible fit for using those  variables. That scalar can then be seen as the coefficient which makes the linear combination of the ‘s to be as close as possible to the . In that sense, the coefficients of a linear regression
![\[\mathbf {{\hat {\boldsymbol {\beta }}}={}(X^{\top }X)^{-1}X^{\top }Y},\]](https://eranraviv.com/wp-content/ql-cache/quicklatex.com-f09aee2e9146bdaa7edd05d68655f2c4_l3.svg "Rendered by QuickLaTeX.com")
are trying to do the same thing. So linear regression is also, and simply, an orthogonal projection:
> y_tild <-  y %*% x / (x%*%x)  * x ; y_tild
[1] 2.735849 4.924528
# The usual OLS equation
> y_tild <- x %*% solve( t(x) %*% x ) %*% t(x) %*% y ; y_tild
         [,1]
[1,] 2.735849
[2,] 4.924528
Relation with independence
Recall the definition of covariance:
![\[\operatorname {cov} (X,Y)=\operatorname {E} {{\big [}(X-\operatorname {E} [X])(Y-\operatorname {E} [Y]){\big ]}}.\]](https://eranraviv.com/wp-content/ql-cache/quicklatex.com-22d68d48e443393d14e413a4e291d7ce_l3.svg "Rendered by QuickLaTeX.com")
This is the theoretical definition, the empirical counterpart is
![\[{\displaystyle \operatorname {cov} (X,Y)={\frac {1}{n}}\sum _{i=1}^{n}(x_{i}- \bar{x} )(y_{i}- \bar{y} ).}\]](https://eranraviv.com/wp-content/ql-cache/quicklatex.com-e689a3e5a189b062627838df590c9402_l3.svg "Rendered by QuickLaTeX.com")
So if the variables are centered;  then the nominator of the cosine function above and the nominator of the covariance are the same. So covariance = 0 means that the angle between the two vectors is 90 degrees. This means that two variables which are orthogonal are (linearly) independent. The reverse also holds of course; if they are independent they are orthogonal.
Relation with Least Angle Regression (LARS)
Like in forward selection we start with all coefficients set equal to zero, and add variables one by one. We choose each “next” variable in a smart way. In forward selection, the next variable to enter is the one which has the highest correlation with the target . It is the same as checking all the pairwise angles between each variable and the target and add that variable with the least angle (which would imply highest correlation). In that sense, forward selection can also be called LARS. However, LARS is more elegant. It is more elegant in that we progress with the chosen variable, but don’t add it in full. Instead of adding the new chosen variable we only add a [portion]*[variable]. The [portion] is small, and we keep on adding small portions of the same variable until another variable “catches up”, meaning it now has the same correlation with the residuals as the previous variable.
You can see that there is a lot of geometry popping up in statistics. To be honest, you can get by without any geometrical intuition, most do in fact. But I think it is nice to know, especially if you like statistics.


