Density estimation belongs with the literature of non-parametric statistics. Using simple bootstrapping techniques we can obtain confidence intervals (CI) for the whole density curve. Here is a quick and easy way to obtain CI’s for different risk measures (VaR, expected shortfall) and using what follows, you can answer all kind of relevant questions.
Density Confidence Interval
To get to the main ideas, let’s start with a simple practical example. We pull data from yahoo, for the SPY ticker which is the ETF which tracks the performance of the S&P 500. We then bootstrap the return series, and estimate the density for each bootstrap sample. This would give us a bunch of density estimates. Those are functions which we can visualize:
Density Confidence Interval

|
1 2 3 4 5 6 7 8 9 10 11 12 13 14 15 16 17 18 19 20 21 22 23 24 25 26 27 28 29 30 |
# required libraries library(quantmod) ; citation("quantmod") # pull the data from yahoo symetf = c('SPY') end<- format(Sys.Date(),"%Y-%m-%d") start<-"2010-01-01" l = length(symetf) dat0 <- lapply(symetf, getSymbols, src="yahoo", from=start, to=end, auto.assign = F,warnings = FALSE,symbol.lookup = F) xd <- dat0[[1]] # define the time indes timee <- index(xd) # convert the data to daily returns retd <- 100*(as.numeric(xd[2:NROW(xd),4])/as.numeric(xd[1:(NROW(xd)-1),4]) -1) # estimate the density dens <- density(retd) # container for the bootstrap samples bootret <- matrix(nrow= TT, ncol= bb) # plot the density of the normal distribution for comparison plot(dnorm, xlim= range(retd), ylim= 1.1*range(dens$y), ylab="", col= "blue", lwd=1.5) bb <- 100 # 100 bootstrap samples TT <- length(retd) for (i in 1:bb){ # make sure you change the default for the replace argument bootret[,i] <- sample(retd, size= TT, replace= T) lines(density(bootret[,i]), lwd=.5, col= "gray") } lines(dens) |
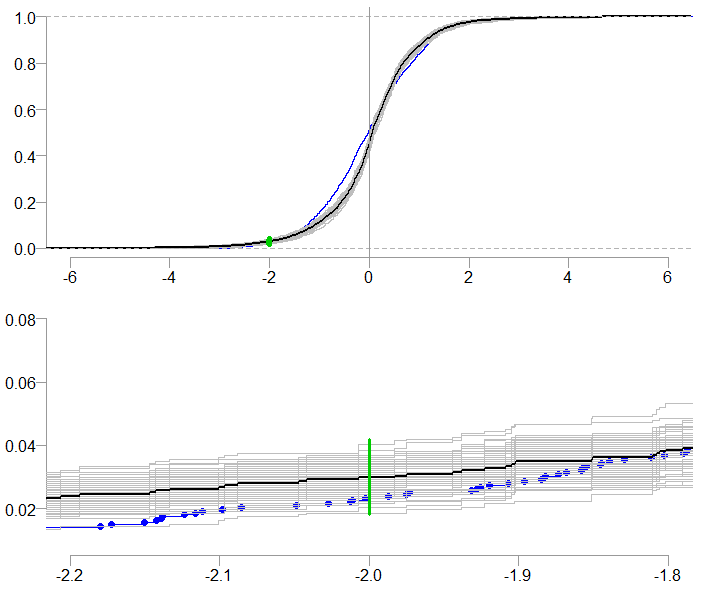
What is plotted is: (1) black, the density estimate of the return series (2) in blue, overlaid a plot of normal density and (3) in grey is bootstrap density estimates, we have 100 of those estimates; one estimate for each bootstrap sample. Fine, so what do we need it for?
Usage
An ever increasing in relevance are questions like: “What is the probability to see a daily realized return below -2%?” If you reached thus far in this post, you probably have some experience in picking up such questions. But now you can attach a confidence interval to the reply. We use here the ecdf function which estimates the empirical cumulative distribution function. We plot the whole distribution function, zooming-in on the segment we care about:
Confidence Interval for the probability of a realized daily return below 2%
|
1 2 3 4 5 6 7 8 9 10 11 12 |
ecdf0 <- dens_two <- list() plot.ecdf(rnorm(n= TT), ylab="", col= "blue", lwd=1.5, xlim= c(-6,6), main= "") for (i in 1:bb){ ecdf0[[i]] <- ecdf(bootret[,i]) pp <- plot.stepfun(ecdf0[[i]], main="", add= T, lwd=.5, col= "gray") dens_two[[i]] <- as.numeric(na.exclude(ifelse(pp$t > -2.05 & pp$t < -1.95, pp$y, NA))) } plot.ecdf(retd, lwd=2, col= coll[1], add= T) abline(v=0) segments(x0= -2, x1= -2, y0= min(unlist(dens_two)), y1= max(unlist(dens_two)), col= 3) |
The bottom chart is simply a zoomed-in version of the top chart. The probability we are after: the probability to see a realized return below the -2% mark, is about 3%. The range of the bootstrapped estimates is superimposed in green, it is roughly between 1% and 3%. A range of [1%,3%] is more comforting than a range of [1%, 6%], that is why we are doing this: to get a feel for the statistical uncertainty which dominates all estimates.
The question “What is the probability to see a daily realized return below x%?” is interesting. We replied with our estimate for that probability, and we added confidence interval around that estimate. A much more common question is “What is the value we are expected to lose, with a probability of (no more than) 5%?”, this is essentially a Value at Risk (VaR) question. An old question, soon to be expired question, as the concept of expected shortfall takes hold (and it will!). Nonetheless, at the moment VaR measure dominates the financial risk management business. What is often overlooked is the level of confidence regarding the estimate. With this practical methodology you can get the confidence intervals to go with your reply. In fact, not only the confidence interval but the whole distribution of the estimate*. A point which will be demonstrated below.
We do exactly the same as we did before, but now, instead of fixing the value (2% in the previous example), we fix the probability (to 5%) and check the x-axis for the possible values.
Confidence Interval for the 5% Value at Risk estimate
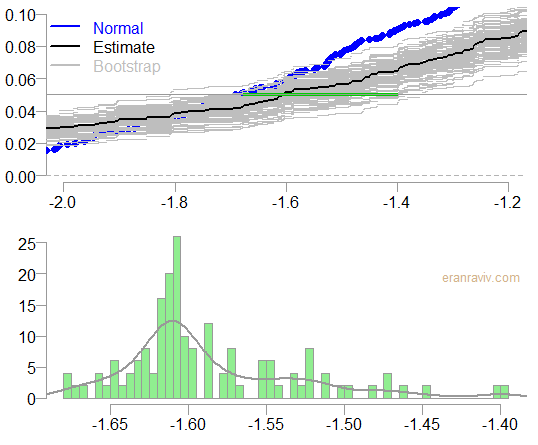
The bottom chart shows the histogram and and density estimate of the 5% VaR estimate.
|
1 2 3 4 5 6 7 8 9 10 11 12 13 14 15 |
knots0 <- list() quant0 <- NULL plot.ecdf(rnorm(n= TT), ylab="", col= "blue", xlim= c(-2,-1.2), main= "", ylim= c(0,0.1)) for (i in 1:bb){ knots0[[i]] <- knots(ecdf0[[i]]) quant0[i] <- quantile(unlist(knots0[[i]]), 0.05, type= 7) plot.ecdf(ecdf0[[i]], main="", add= T, col= "gray") } plot.ecdf(retd, col= 1, add= T) segments(x0= min(quant0), x1= max(quant0), y0= 0.05, y1= 0.05, col= 3) abline(h=0.05) hist(quant0, main="", freq= F, ylab="", col= "lightgreen") lines(density(quant0)) |
recommended reading
I recommend the following excellent book which I enjoyed very much. The author is Larry Wasserman, who is incredibly knowledgeable. He used to write a fantastic blog which he retired, sadly.
All of Nonparametric Statistics

* Of course, there is noise around the density estimate as well- I don’t touch that in this post.


One comment on “Density Confidence Interval”