I recently spotted the following intriguing paper: Market intraday momentum.
From the abstract of that paper:
Based on high frequency S&P 500 exchange-traded fund (ETF) data from 1993–2013, we show an intraday momentum pattern: the first half-hour return on the market as measured from the previous day’s market close predicts the last half-hour return. This predictability, which is both statistically and economically significant is stronger on more volatile days, on higher volume days, on recession days, and on major macroeconomic news release days.
Nice! Looks like we can all become rich now. I mean, given how it’s written, it should be quite easy for any individual with a trading account and a mouse to leverage up and start accumulating. Maybe this is so, but let’s have an informal closer look, with as little effort as possible, and see if there is anything we can say about this idea.
Long ago I used to day-trade, at some point I collected intraday data for my own backtesting and placed it online for replication of a post about realized volatility. The data is an array with dimension [390, 8, 250]. The 250 refers to days: 250 trading days ending in 22/10/2012. The 8 refers to the number of columns which are basically the open, low, high close, volume etc. The 390 refers to the number of minutes in each day. We can load it in R using the load(file = ".../prlev2.RData")*. The ticker is the SPY ETF. It’s only one year but let’s see if the price behavior of that year supports the claim in the aforementioned Market intraday momentum paper.
dim(prlev)
[1] 390   8 250
head(prlev[,,1])
# The first 4 columns are open, high, low and close
# The first row is for the first minute...
       [,1]   [,2]   [,3]   [,4]  [,5]    [,6] [,7] [,8]
[1,] 124.17 124.17 124.09 124.10 15180 124.133    0 3584
[2,] 124.09 124.10 124.06 124.09  4848 124.091    0 1209
[3,] 124.10 124.40 124.09 124.39 10067 124.272    0 2527
[4,] 124.39 124.41 124.34 124.39  7576 124.374    0 2543
[5,] 124.39 124.44 124.33 124.33  8156 124.397    0 2433
[6,] 124.34 124.37 124.28 124.33  6434 124.314    0 1864

close_prices <- prlev[390, 4, ] # get closing prices
# snapshot the 30 mins price, over the previous day's close (so we remove the last day: -250)
halfh_ret <- 100 * (prlev[30, 4, -1] / close_prices[-250] - 1)
# The returns over the last 30 mins of the day
last_halfh_ret <- 100 * (prlev[390, 4, -1] / prlev[360, 4, -1] - 1)
It looks like that:
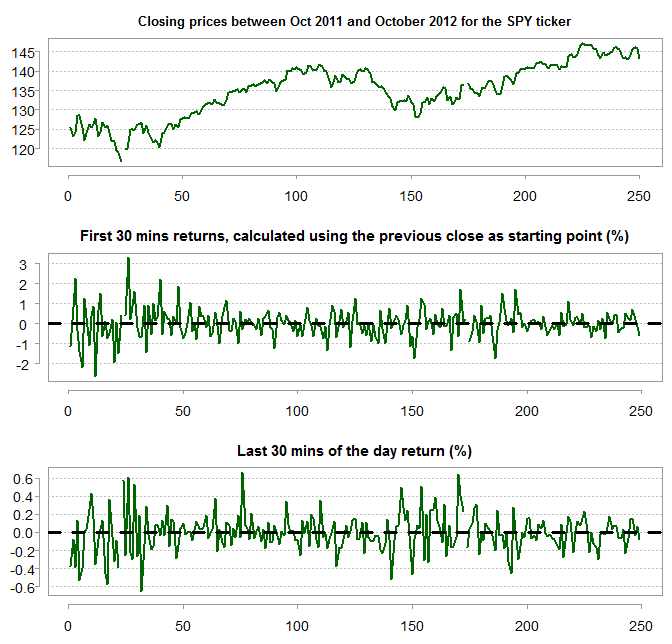 To examine whether there is a predictive value we can plot the last 30 mins returns over the first 30 mins (remember those include also the overnight returns because they are calculated based on the close of the previous day, hence the wider dispersion in returns).
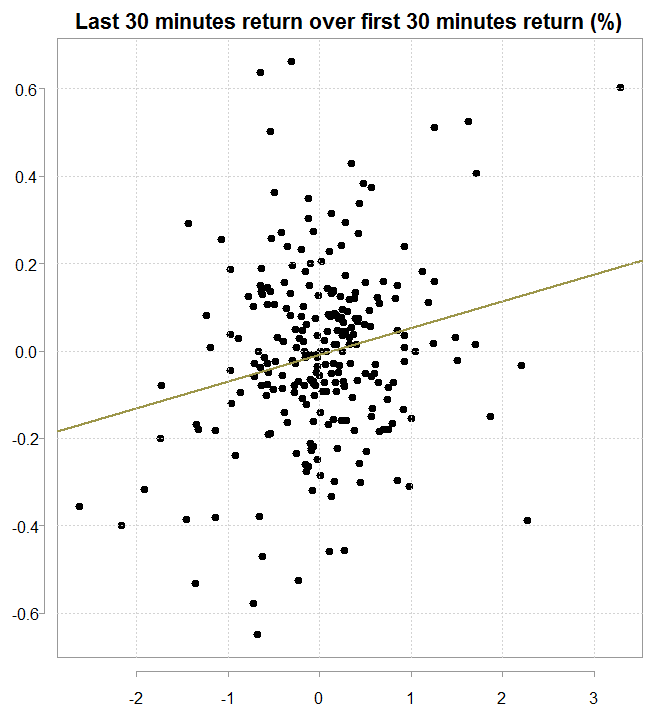 The figure supports the claim, and a simple regression model returns:
summary(lm(last_halfh_ret ~ halfh_ret))
Call:
lm(formula = last_halfh_ret ~ halfh_ret)
Residuals:
     Min       1Q   Median       3Q      Max
-0.59909 -0.10370  0.00337  0.10641  0.68953
Coefficients:
             Estimate Std. Error t value Pr(>|t|)
(Intercept) -0.008483   0.012815  -0.662 0.508609
halfh_ret    0.061214   0.017723   3.454 0.000652 ***
---
Residual standard error: 0.2005 on 243 degrees of freedom
  (4 observations deleted due to missingness)
Multiple R-squared:  0.0468,	Adjusted R-squared:  0.04287
F-statistic: 11.93 on 1 and 243 DF,  p-value: 0.0006516
So significant slope indicates that if the first half an hour of the returns are up by one percent, and if all the usual assumptions hold (linearity etc.) then on average we should see the returns of the last 30 minutes of the day up by 0.06%, which may give sufficient edge for money-making. Especially in this specific heavily-traded SPY ticker.
The However we have all been waiting for
In statistics there is the concept of “influence”. The math is quite ugly (wikipedia link) but the concept is super simple and super important. Which data-points drive the results? The way to measure influence is by using something of an “in-contrast” principle: what happen to the results if we remove this or that observation? If the results don’t change much, the observation is then told off for being uninfluential*. This “influence” concept is somewhat related to resistant regression. Robust regression tries to dampen the influence of outliers. Resistant regression estimates the parameters by altogether removing any influence from outliers. There are few methods we can use to perform resistant regression. We use here the least quantile of squares method as we did last time. It is simple enough to implement. Formally:
![\[\widehat{\beta} = \underset{\beta}{argmin \;} \varepsilon_{ (\nu)}^2 ,\]](https://eranraviv.com/wp-content/ql-cache/quicklatex.com-9577b4e0651466145345fdfe1d21b50b_l3.svg "Rendered by QuickLaTeX.com")
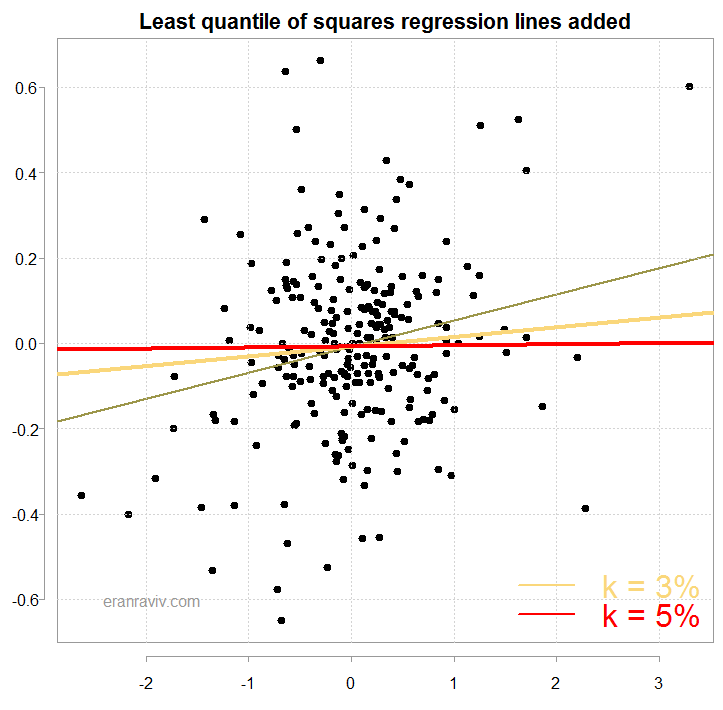
so we find the estimate which minimizes the squared order residual, but only those residuals which belong to the  region. The region is selected as the arguably most representative of where the data is expected to lie. The region in our case would exclude those observations which are at the top and bottom k percent, with k being 3% and 5% for example. This is plot of the new resulting regression lines from using the least quantile of squares method:
Here is the function needed to compute those regression lines:
> mltsreg = function(x = ret, y =ret_spy, k){
+ trimmedx = x[x > quantile(x,k) & x < quantile(x, 1 - k) ]
+ trimmedy = y[x > quantile(x,k) & x < quantile(x, 1 - k) ]
+ MtrimmedReg = lm(trimmedx ~ trimmedy)
+ MtrimmedReg
+ }
>
> res_reg <- mltsreg(x= na.omit(last_halfh_ret), y= na.omit(halfh_ret), k= 0.03)
> summary(res_reg)

Call:
lm(formula = trimmedx ~ trimmedy)

Residuals:
     Min       1Q   Median       3Q      Max
-0.43131 -0.08898 -0.00363  0.10558  0.38083

Coefficients:
             Estimate Std. Error t value Pr(>|t|)
(Intercept) -0.007921   0.010594  -0.748    0.455
trimmedy     0.022814   0.015779   1.446    0.150

Residual standard error: 0.1609 on 229 degrees of freedom
Multiple R-squared:  0.009046,	Adjusted R-squared:  0.004719
F-statistic:  2.09 on 1 and 229 DF,  p-value: 0.1496

>
> res_reg <- mltsreg(x= na.omit(last_halfh_ret), y= na.omit(halfh_ret), k= 0.05)
> summary(res_reg)

Call:
lm(formula = trimmedx ~ trimmedy)

Residuals:
     Min       1Q   Median       3Q      Max
-0.32626 -0.08506  0.00088  0.09837  0.34319

Coefficients:
             Estimate Std. Error t value Pr(>|t|)
(Intercept) -0.007636   0.009729  -0.785    0.433
trimmedy     0.002625   0.015738   0.167    0.868

Residual standard error: 0.1444 on 219 degrees of freedom
Multiple R-squared:  0.000127,	Adjusted R-squared:  -0.004439
F-statistic: 0.02783 on 1 and 219 DF,  p-value: 0.8677
As you can see, when k= 0.03 you lose significance, and when k= 0.05 the line is flat. Clearly the results are driven by a small percentage of the data. Looking again at the abstract, the authors acknowledge that finding, in a way: “… stronger on more volatile days, on higher volume days, on recession days, and on major macroeconomic news release days.”
Conclusion
So if the results may be driven by such a small percentage of data points, I doubt that a full blown backtesting exercise would yield any meaningful tradeable strategy. There can be very many months of random-walking at best, which can be costly. That said, momentum is known to work interday so it can be that it is extendable to intraday, especially when the returns of the first 30 mins include the overnight returns. The Journal of Financial Economics is a top journal in the field, and so there is no doubt that the paper contains meaningful contribution. But the contribution is probably not “do this and get rich”. What is shown above is a flat, minimum effort statistical analysis and should be taken only as such.
Footnotes
* UPDATE: some people had issues with the data. You can download it to your computer from here and load it to R from the relevant directory.
* It is a bit more complicated since “results” are not yet well-defined. We usually speak about changes in particular parameters, an observation can have different influence on different parameters.


One comment on “Market intraday momentum”