Sometimes I read academic literature, and often times those papers contain some proofs. I usually gloss over some innocent-looking assumptions on moments’ existence, invariably popping before derivations of theorems or lemmas. Here is one among countless examples, actually taken from Making and Evaluating Point Forecasts:
Tag: Statistics
Why statistical bootstrap
I often write about bootstrap (here an example and here a critique). I refer to it here as one of the most consequential advances in modern statistics. When I wrote that last post I was searching the web for a simple explanation to quickly show how useful bootstrap is, without boring the reader with the underlying math. Since I was not content with anything I could find, I decided to write it up, so here we go.
Laws of large numbers
The laws of large numbers are the cornerstones of asymptotic theory. ‘Large numbers’ in this context does not refer to the value of the numbers we are dealing with, rather, it refers to a large number of repetitions (or trials, or experiments, or iterations). This post takes a stab at explaining the difference between the strong law of large numbers (SLLN) and the weak law of large numbers (WLLN). I think it is important, not amply clear to most, and I will need it as a reference in future posts.
Forecast averaging example
Especially in economics/econometrics, modellers do not believe their models reflect reality as it is. No, the yield curve does NOT follow a three factor Nelson-Siegel model, the relation between a stock and its underlying factors is NOT linear, and volatility does NOT follow a Garch(1,1) process, nor Garch(?,?) for that matter. We simply look at the world, and try to find an apt description of what we see.
Measurement error bias
What is measurement error bias?
Errors-in-variables, or measurement error situation happens when your right hand side variable(s); your $x$ in a $y_t = \alpha + \beta x_t + \varepsilon_t$ model is measured with error. If $x$ represents the price of a liquid stock, then it is accurately measured because the trading is so frequent. But if $x$ is a volatility, well, it is not accurately measured. We simply don’t yet have the power to tame this variable variable.
Unlike the price itself, volatility estimates change with our choice of measurement method. Since no model is a perfect depiction of reality, we have a measurement error problem on our hands.
Ignoring measurement errors leads to biased estimates and, good God, inconsistent estimates.
ASA statement on p-values
There are many problems with p-values, and I too have chipped in at times. I recently sat in a presentation of an excellent paper, to be submitted to the highest ranked journal in the field. The authors did not conceal their ruthless search for those mesmerizing asterisks indicating significance. I was curious to see many in the crowd are not aware of current history in the making regarding those asterisks.
The web is now swarming with thought-provoking discussions about the recent American Statistical Association (ASA) statement on p-values. Despite their sincere efforts, there are still a lot of back-and-forth over what they actually mean. Here is how I read it.
Multivariate volatility forecasting, part 6 – sparse estimation
First things first.
What do we mean by sparse estimation?
Sparse – thinly scattered or distributed; not thick or dense.
Curse of dimensionality part 2: forecast combinations
In a previous post we discussed the term ‘curse of dimensionality’ and showed how it manifests itself, in practice. Here we give another such example.
Linear regression assumes nothing about your data
We often see statements like “linear regression makes the assumption that the data is normally distributed”, “Data has no or little multicollinearity”, or other such blunders (you know who you are..).
Let’s set the whole thing straight.
Linear regression assumes nothing about your data
It has to be said. Linear regression does not even assume linearity for that matter, I argue. It is simply an estimator, a function. We don’t need to ask anything from a function.
Consider that linear regression has an additional somewhat esoteric, geometric interpretation. When we perform a linear regression you simply find the best possible, closest possible, linear projection we can. A linear combination in your X space that is as close as possible in a Euclidean sense (squared distance) to some other vector y.
That is IT! a simple geometric relation. No assumptions needed whatsoever.
You don’t ask anything from the average when you use it as an estimate for the mean do you? So why do that when you use regression? We only need to ask more if we do something more.
Curse of dimensionality part 1: Value at Risk
The term ‘curse of dimensionality’ is now standard in advanced statistical courses, and refers to the disproportional increase in data which is needed to allow only slightly more complex models. This is true in high-dimensional settings. Here is an illustration of the ‘Curse of dimensionality’ in action.
Present-day great statistical discoveries
Some time during the 18th century the biologist and geologist Louis Agassiz said: “Every great scientific truth goes through three stages. First, people say it conflicts with the Bible. Next they say it has been discovered before. Lastly they say they always believed it”. Nowadays I am not sure about the Bible but yeah, it happens.
I express here my long-standing and long-lasting admiration for the following triplet of present-day great discoveries. The authors of all three papers had initially struggled to advance their ideas, which echos the quote above. Here they are, in no particular order.
Correlation and correlation structure (3), estimate tail dependence using regression
What is tail dependence really? Say the market had a red day and saw a drawdown which belongs with the 5% worst days (from now on simply call it a drawdown):
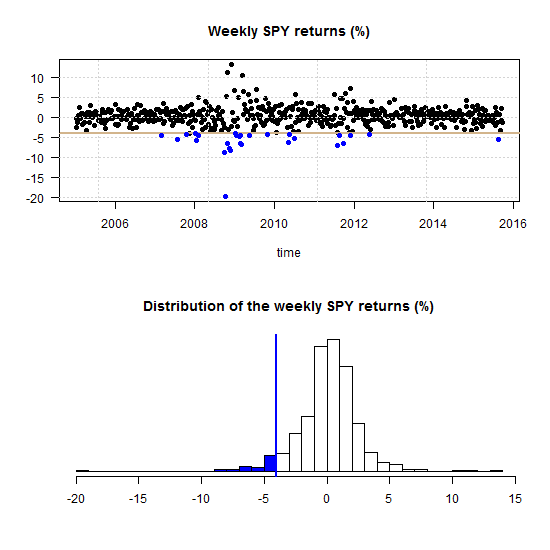
One can ask what is now, given that the market is in the blue region, the probability of a a drawdown in a specific stock?
Multivariate volatility forecasting (4), factor models
To be instructive, I always use very few tickers to describe how a method works (and this tutorial is no different). Most of the time is spent on methods that we can easily scale up. Even if exemplified using only say 3 tickers, a more realistic 100 or 500 is not an obstacle. But, is it really necessary to model the volatility of each ticker individually? No.
If we want to forecast the covariance matrix of all components in the Russell 2000 index we don’t leave much on the table if we model only a few underlying factors, much less than 2000.
Volatility factor models are one of those rare cases where the appeal is both theoretical and empirical. The idea is to create a few principal components and, under the reasonable assumption that they drive the bulk of comovement in the data, model those few components only.
Correlation and correlation structure (2), copulas
This post is about copulas and heavy tails. In a previous post we discussed the concept of correlation structure. The aim is to characterize the correlation across the distribution. Prior to the global financial crisis many investors were under the impression that they were diversified, and they were, for how things looked there and then. Alas, when things went south, correlation in the new southern regions turned out to be different\stronger than that in normal times. The hard-won diversification benefits evaporated exactly when you needed them the most. This adversity has to do with fat-tail in the joint distribution, leading to great conceptual and practical difficulties. Investors and bankers chose to swallow the blue pill, and believe they are in the nice Gaussian world, where the math is magical and elegant. Investors now take the red pill, where the math is ugly and problems abound.
Multivariate volatility forecasting, part 2 – equicorrelation
Last time we showed how to estimate a CCC and DCC volatility model. Here I describe an advancement labored by Engle and Kelly (2012) bearing the name: Dynamic equicorrelation. The idea is nice and the paper is well written.
Departing where the previous post ended, once we have (say) the DCC estimates, instead of letting the variance-covariance matrix be, we force some structure by way of averaging correlation across assets. Generally speaking, correlation estimates are greasy even without any breaks in dynamics, so I think forcing some structure is for the better.