Portfolio Construction with R

Preview

Constructing a portfolio means allocating your money between few chosen assets. The simplest thing you can do is evenly split your money between few chosen assets. Simple as it is, good research shows it is just fine, and even better than other more sophisticated methods (for example Optimal Versus Naive Diversification: How Inefficient is the 1/N). However, there is also good research that declares the opposite (for example Large Dynamic Covariance Matrices) so go figure.

Anyway, this post shows a few of the most common to build a portfolio. We will discuss portfolios which are optimized for:

  • Equal Risk Contribution
  • Global Minimum Variance
  • Minimum Tail-Dependence
  • Most Diversified
  • Equal weights

We will optimize based on half the sample and see out-of-sample results in the second half. Simply speaking, how those portfolios have performed.

Continue reading

Bitcoin exponential growth

Is bitcoin a bubble? I don’t know. What defines a bubble? The price should drastically overestimate the underlying fundamentals. I simply don’t know much about blockchain to have an opinion there. A related characteristic is a run-away price. Going up fast just because it is going up fast.

Continue reading

Bitcoin investing

Bitcoin is a cryptocurrency created in 2008. I have never belonged with team “gets it” when it comes to Bitcoin investing, but perhaps time has come to reconsider.

Continue reading

Visualizing Tail Risk

Tail risk conventionally refers to the risk of a large and sharp draw down of the portfolio. How large is subjective and depends on how you define what is a tail.

A lot of research is directed towards having a good estimate of the tail risk. Some fairly new research also now indicates that investors perceive tail risk to be a stand-alone risk to be compensated for, rather than bundled together with the usual variability of the portfolio. So this risk now gets even more attention.

Continue reading

Density Confidence Interval

Density estimation belongs with the literature of non-parametric statistics. Using simple bootstrapping techniques we can obtain confidence intervals (CI) for the whole density curve. Here is a quick and easy way to obtain CI’s for different risk measures (VaR, expected shortfall) and using what follows, you can answer all kind of relevant questions.

Continue reading

Multivariate Volatility Forecast Evaluation

The evaluation of volatility models is gracefully complicated by the fact that, unlike other time series, even the realization is not observable. Two researchers would never disagree about what was yesterday’s stock price, but they can easily disagree about what was yesterday’s stock volatility. Because we don’t observe volatility directly, each of us uses own proxy of choice. There are many ways to skin this cat (more on volatility proxy here).

In a previous post Univariate volatility forecast evaluation we considered common ways in which we can evaluate how good is our volatility model, dealing with one time-series at a time. But how do we evaluate, or compare two models in a multivariate settings, with two covariance matrices?

Continue reading

Why bad trading strategies may perform well? Mathematical explanation

You probably know that even a trading strategy which is actually no different from a random walk (RW henceforth) can perform very well. Perhaps you chalk it up to short-run volatility. But in fact there is a deeper reason for this to happen, in force. If you insist on using and continuously testing a RW strategy, you will find, at some point with certainty, that it has significant outperformance.

This post explains why is that.

Continue reading

The case for Regime-Switching GARCH

GARCH models are very responsive in the sense that they allow the fit of the model to adjust rather quickly with incoming observations. However, this adjustment depends on the parameters of the model, and those may not be constant. Parameters’ estimation of a GARCH process is not as quick as those of say, simple regression, especially for a multivariate case. Because of that, I think, the literature on time-varying GARCH is not yet at its full speed. This post makes the point that there is a need for such a class of models. I demonstrate this by looking at the parameters of Threshold-GARCH model (aka GJR GARCH), before and after the 2008 crisis. In addition, you can learn how to make inference on GARCH parameters without relying on asymptotic normality, i.e. using bootstrap.

Continue reading

On the 60/40 portfolio mix

Not sure why is that, but traditionally we consider 60% stocks and 40% bonds to be a good portfolio mix. One which strikes decent balance between risk and return. I don’t want to blubber here about the notion of risk. However, I do note that I feel uncomfortable interchanging risk with volatility as we most often do. I am not unhappy with volatility, I am unhappy with realized loss, that is decidedly not the same thing. Not to mention volatility does not have to be to the downside (though I just did).

Let’s take a look at this 60/40 mix more closely.

Continue reading

Correlation and correlation structure (3), estimate tail dependence using regression

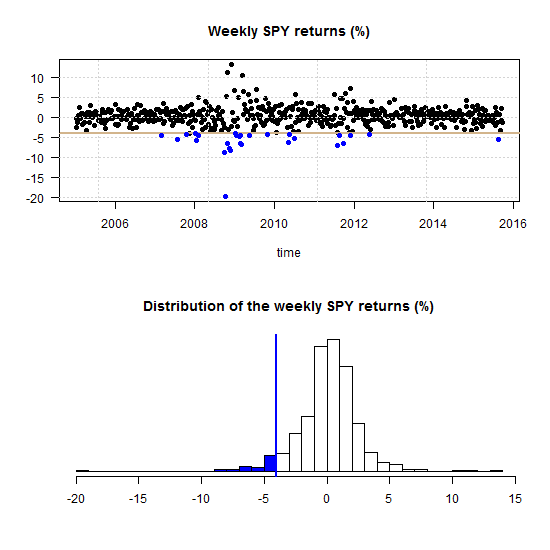
What is tail dependence really? Say the market had a red day and saw a drawdown which belongs with the 5% worst days (from now on simply call it a drawdown):
weekly SPY returns
One can ask what is now, given that the market is in the blue region, the probability of a a drawdown in a specific stock?

Continue reading

Multivariate volatility forecasting (4), factor models

To be instructive, I always use very few tickers to describe how a method works (and this tutorial is no different). Most of the time is spent on methods that we can easily scale up. Even if exemplified using only say 3 tickers, a more realistic 100 or 500 is not an obstacle. But, is it really necessary to model the volatility of each ticker individually? No.

If we want to forecast the covariance matrix of all components in the Russell 2000 index we don’t leave much on the table if we model only a few underlying factors, much less than 2000.

Volatility factor models are one of those rare cases where the appeal is both theoretical and empirical. The idea is to create a few principal components and, under the reasonable assumption that they drive the bulk of comovement in the data, model those few components only.

Continue reading