In a previous post: Most popular machine learning R packages, trying to hash out what are the most frequently used machine learning packages, I simply chose few names from my own memory. However, there is a CRAN task views web page which “aims to provide some guidance which packages on CRAN are relevant for tasks related to a certain topic.” So instead of relying on my own experience, in this post I correct for the bias by simply looking at the topic
Machine Learning & Statistical Learning. There are currently around 100 of those packages on CRAN.
R tips and tricks – higher-order functions
A higher-order function is a function that takes one or more functions as arguments, and\or returns a function as its result. This can be super handy in programming when you want to tilt your code towards readability and still keep it concise.
Most popular posts – 2018
2019 is well underway. 2018 was personally difficult, so I am happy it’s behind us. Without further ado, here is what my analytics report shows to be the three most popular posts for 2018:
Reproducible Finance with R – book review
Reproducible Finance with R is a clever book, with modern treatment of classical concepts. Here below is what I liked- and disliked about the book.
Create own Recession Indicator using Mixture Models
Context
Broadly speaking, we can classify financial markets conditions into two categories: Bull and Bear. The first is a “todo bien” market, tranquil and generally upward sloping. The second describes a market with a downturn trend, usually more volatile. It is thought that those bull\bear terms originate from the way those animals supposedly attack. Bull thrusts its horns up while a bear swipe its paws down. At any given moment, we can only guess the state in which we are in, there is no way of telling really; simply because those two states don’t have a uniformly exact definitions. So basically we never actually observe a membership of an observation. In this post we are going to use (finite) mixture models to try and assign daily equity returns to their bull\bear subgroups. It is essentially an unsupervised clustering exercise. We will create our own recession indicator to help us quantify if the equity market is contracting or not. We use minimal inputs, nothing but equity return data. Starting with a short description of Finite Mixture Models and moving on to give a hands-on practical example.
Price Movement Prediction – another paper
Just finished reading the paper Stock Market’s Price Movement Prediction With LSTM Neural Networks. The abstract attractively reads: “The results that were obtained are promising, getting up to an average of 55.9% of accuracy when predicting if the price of a particular stock is going to go up or not in the near future.”, I took the bait. You shouldn’t.
Test of Equality Between Two Densities
Are returns this year actually different than what can be expected from a typical year? Is the variance actually different than what can be expected from a typical year? Those are fairly light, easy to answer questions. We can use tests for equality of means or equality of variances.
But how about the following question:
is the profile\behavior of returns this year different than what can be expected in a typical year?
This is a more general and important question, since it encompasses all moments and tail behavior. And it is not as trivial to answer.
In this post I am scratching an itch I had since I wrote Understanding Kullback – Leibler Divergence. In the Kullback – Leibler Divergence post we saw how to quantify the difference between densities, exemplified using SPY return density per year. Once I was done with that post I was thinking there must be a way to test the difference formally, rather than just quantify, visualize and eyeball. And indeed there is. This post aim is to show to formally test for equality between densities.
Orthogonality in Statistics
Orthogonality in mathematics
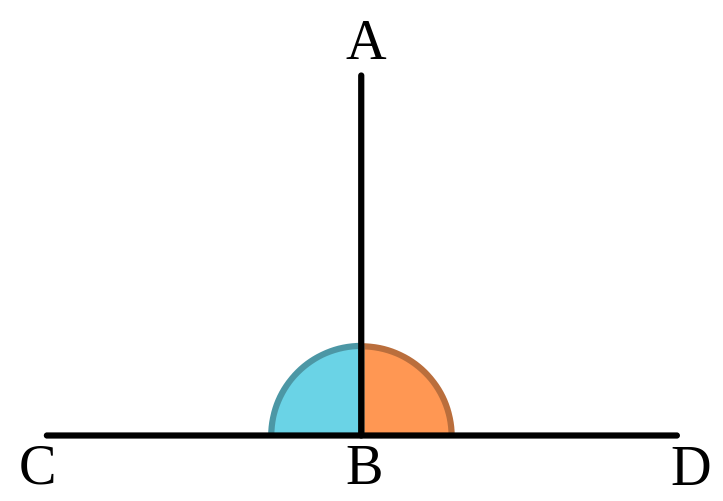
The word Orthogonality originates from a combination of two words in ancient Greek: orthos (upright), and gonia (angle). It has a geometrical meaning. It means two lines create a 90 degrees angle between them. So one line is perpendicular to the other line. Like so:
Even though Orthogonality is a geometrical term, it appears very often in statistics. You probably know that in a statistical context orthogonality means uncorrelated, or linearly independent. But why?
Why use a geometrical term to describe a statistical relation between random variables? By extension, why does the word angle appears in the incredibly common regression method least-angle regression (LARS)? Enough losing sleep over it (as you undoubtedly do), an extensive answer below.
Visualizing Time series Data
This post has two goals. I hope to make you think about your graphics, and think about the future of data-visualization. An example is given using some simulated time series data. A very quick read.
Kaggle Experience
At least in part, a typical data-scientist is busy with forecasting and prediction. Kaggle is a platform which hosts a slew of competitions. Those who have the time, energy and know-how to combat real-life problems, are huddling together to test their talent. I highly recommend this experience. A side effect of tackling actual problems (rather than those which appear in textbooks), is that most of the time you are not at all enjoying new wonderful insights or exploring fascinating unfamiliar, ground-breaking algos. Rather, you are handling\wrangling\manipulating data, which is.. ugly and boring, but necessary and useful.
I tried my powers few years ago, and again about 6 months ago in one of those competitions called Toxic Comment Classification Challenge. Here are my thoughts on that short experience and some insight from scraping the results of that competition.
Market intraday momentum
I recently spotted the following intriguing paper: Market intraday momentum.
From the abstract of that paper:
Based on high frequency S&P 500 exchange-traded fund (ETF) data from 1993–2013, we show an intraday momentum pattern: the first half-hour return on the market as measured from the previous day’s market close predicts the last half-hour return. This predictability, which is both statistically and economically significant is stronger on more volatile days, on higher volume days, on recession days, and on major macroeconomic news release days.
Nice! Looks like we can all become rich now. I mean, given how it’s written, it should be quite easy for any individual with a trading account and a mouse to leverage up and start accumulating. Maybe this is so, but let’s have an informal closer look, with as little effort as possible, and see if there is anything we can say about this idea.
R tips and tricks – the assign() function
The R language has some quirks compared to other languages. One thing which you need to constantly watch for when moving to- or from R, is that R starts its indexing at one, while almost all other languages start indexing at zero, which takes some getting used to. Another quirk is the explicit need for clarity when modifying a variable, compared with other languages.
Take python for example, but I think it looks the same in most common languages:
R in Finance highlights
The yearly R in Finance conference is one of my favorites:
Curse of dimensionality part 3: Higher-Order Comoments
Higher moments such as Skewness and Kurtosis are not as explored as they should be.
These moments are crucial for managing portfolio risk. At least as important as volatility, if not more. Skewness relates to asymmetry risk and Kurtosis relates to tail risk.
Despite their great importance, those higher moments enjoy only a small portion of attention compared with their lower more friendly moments: the mean and the variance. In my opinion, one reason for this may be the impossibility of estimating those moments, estimating them accurately that is.
It is yet another situation where Curse of Dimensonality rears its enchanting head (and an idea for a post is born..).
Portfolio Construction with R
Preview
Constructing a portfolio means allocating your money between few chosen assets. The simplest thing you can do is evenly split your money between few chosen assets. Simple as it is, good research shows it is just fine, and even better than other more sophisticated methods (for example Optimal Versus Naive Diversification: How Inefficient is the 1/N). However, there is also good research that declares the opposite (for example Large Dynamic Covariance Matrices) so go figure.
Anyway, this post shows a few of the most common to build a portfolio. We will discuss portfolios which are optimized for:
- Equal Risk Contribution
- Global Minimum Variance
- Minimum Tail-Dependence
- Most Diversified
- Equal weights
We will optimize based on half the sample and see out-of-sample results in the second half. Simply speaking, how those portfolios have performed.